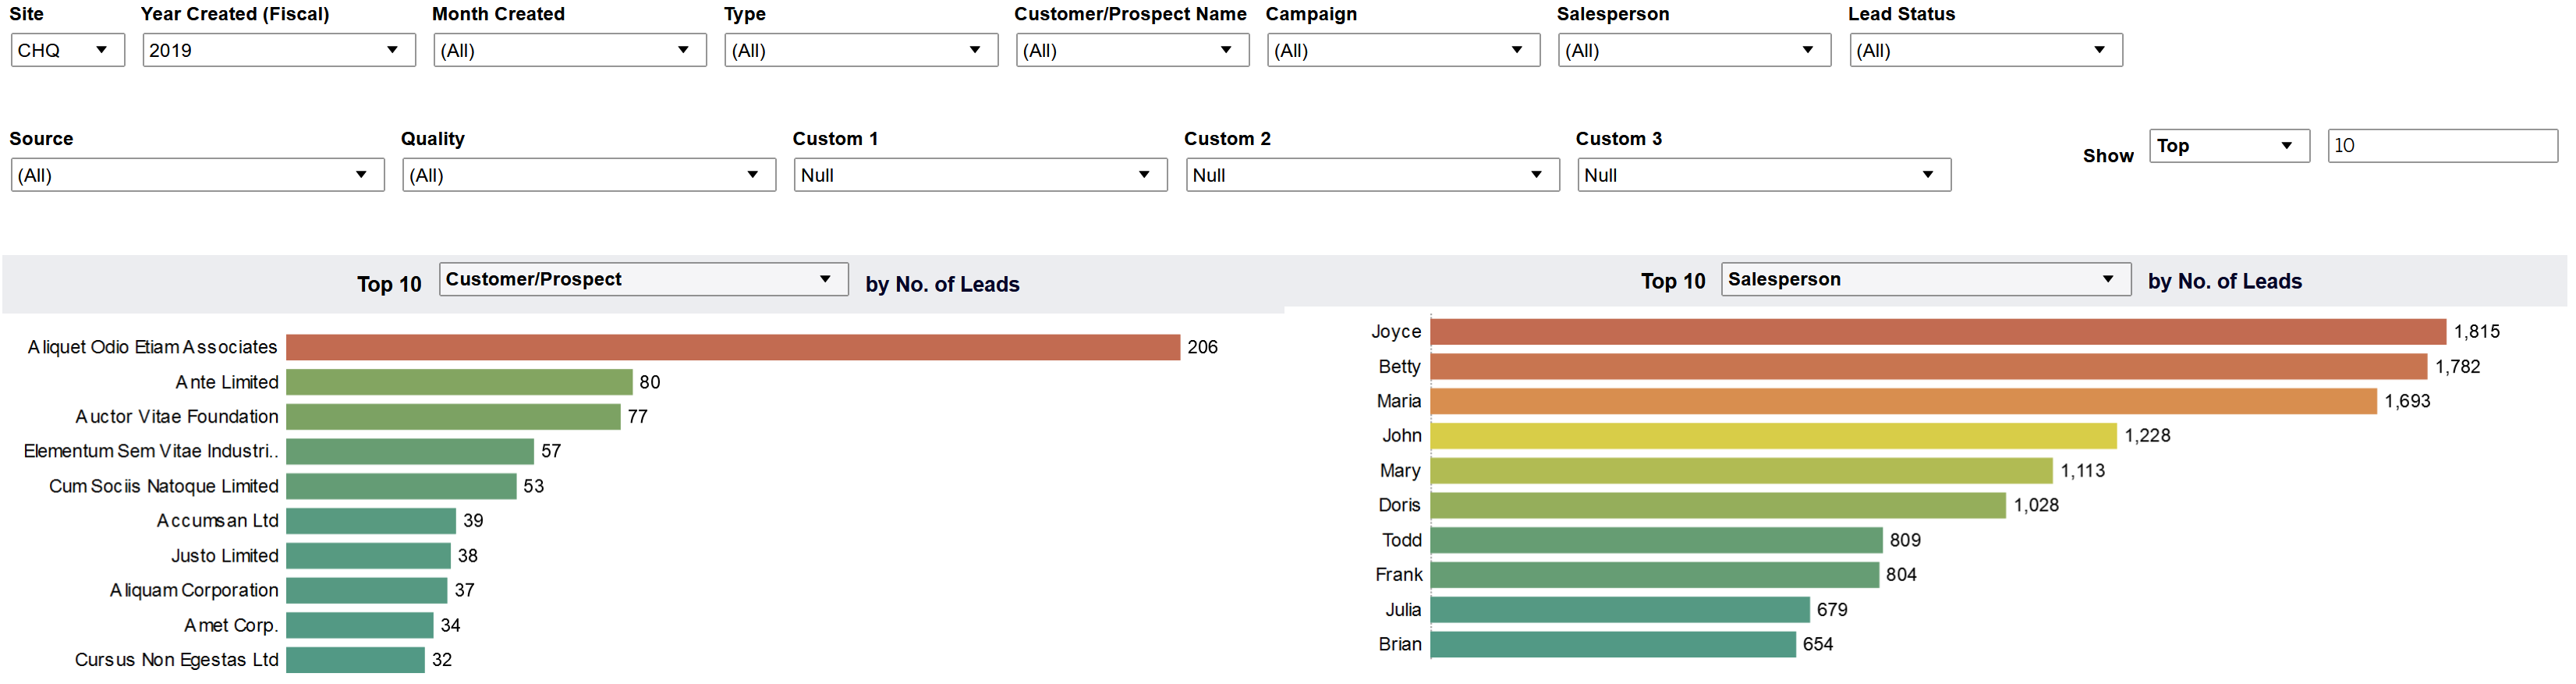
#1 Lead Generation
Below in Figure 1 is an example of how Leads can be tracked. In the graph to the lower left we can see how many Leads have been generated for a specific Customer/Prospect and to the lower right which Salespersons have been generating these Leads for a given time period. This enables a Sales Organization to quickly see where Leads are being generated and who is actually generating them.
#2 Estimates / Opportunities Generated
Once a Lead is identified then how effectively is the organization in general and the salesperson in particular in moving the sales process along by generating Estimates and/or Opportunities from those Leads. Depending on the organization’s business model they may be focused on generating what are called Quotes or Estimates. These are specifically a customized bid based on a combination of an organization’s products and services. Opportunities on the other hand are any potential sale that may be based on a more standard product set or offering from the organization.
Below we will examine how both can be tracked with an Analytics system. In Figure 2 below we see a comprehensive look at the Estimates/Quotes that an organization has developed for a specific time period (in this example over the last 4 years.) This data is then organized graphically in the upper left by dollar amount by Customer. Then in the upper right by dollar amount by Salesperson. Then in the lower left it is by dollar amount by Item. Finally in the lower right it is shown by dollar amount for specific Sales Territories. This gives a person analyzing sales activities a very complete and broad view of what is going on in the sales arena. It tells them where Estimates are being provided, who is providing them, what products are included in these Estimates, and in what Sales geography (i.e. Territory) are we providing these Estimates. Each of these has been filtered to just show the Top 10 in each category, but that value is selectable and could be reset to any integer value such as top 20, Top 100, Top 1000, etc.
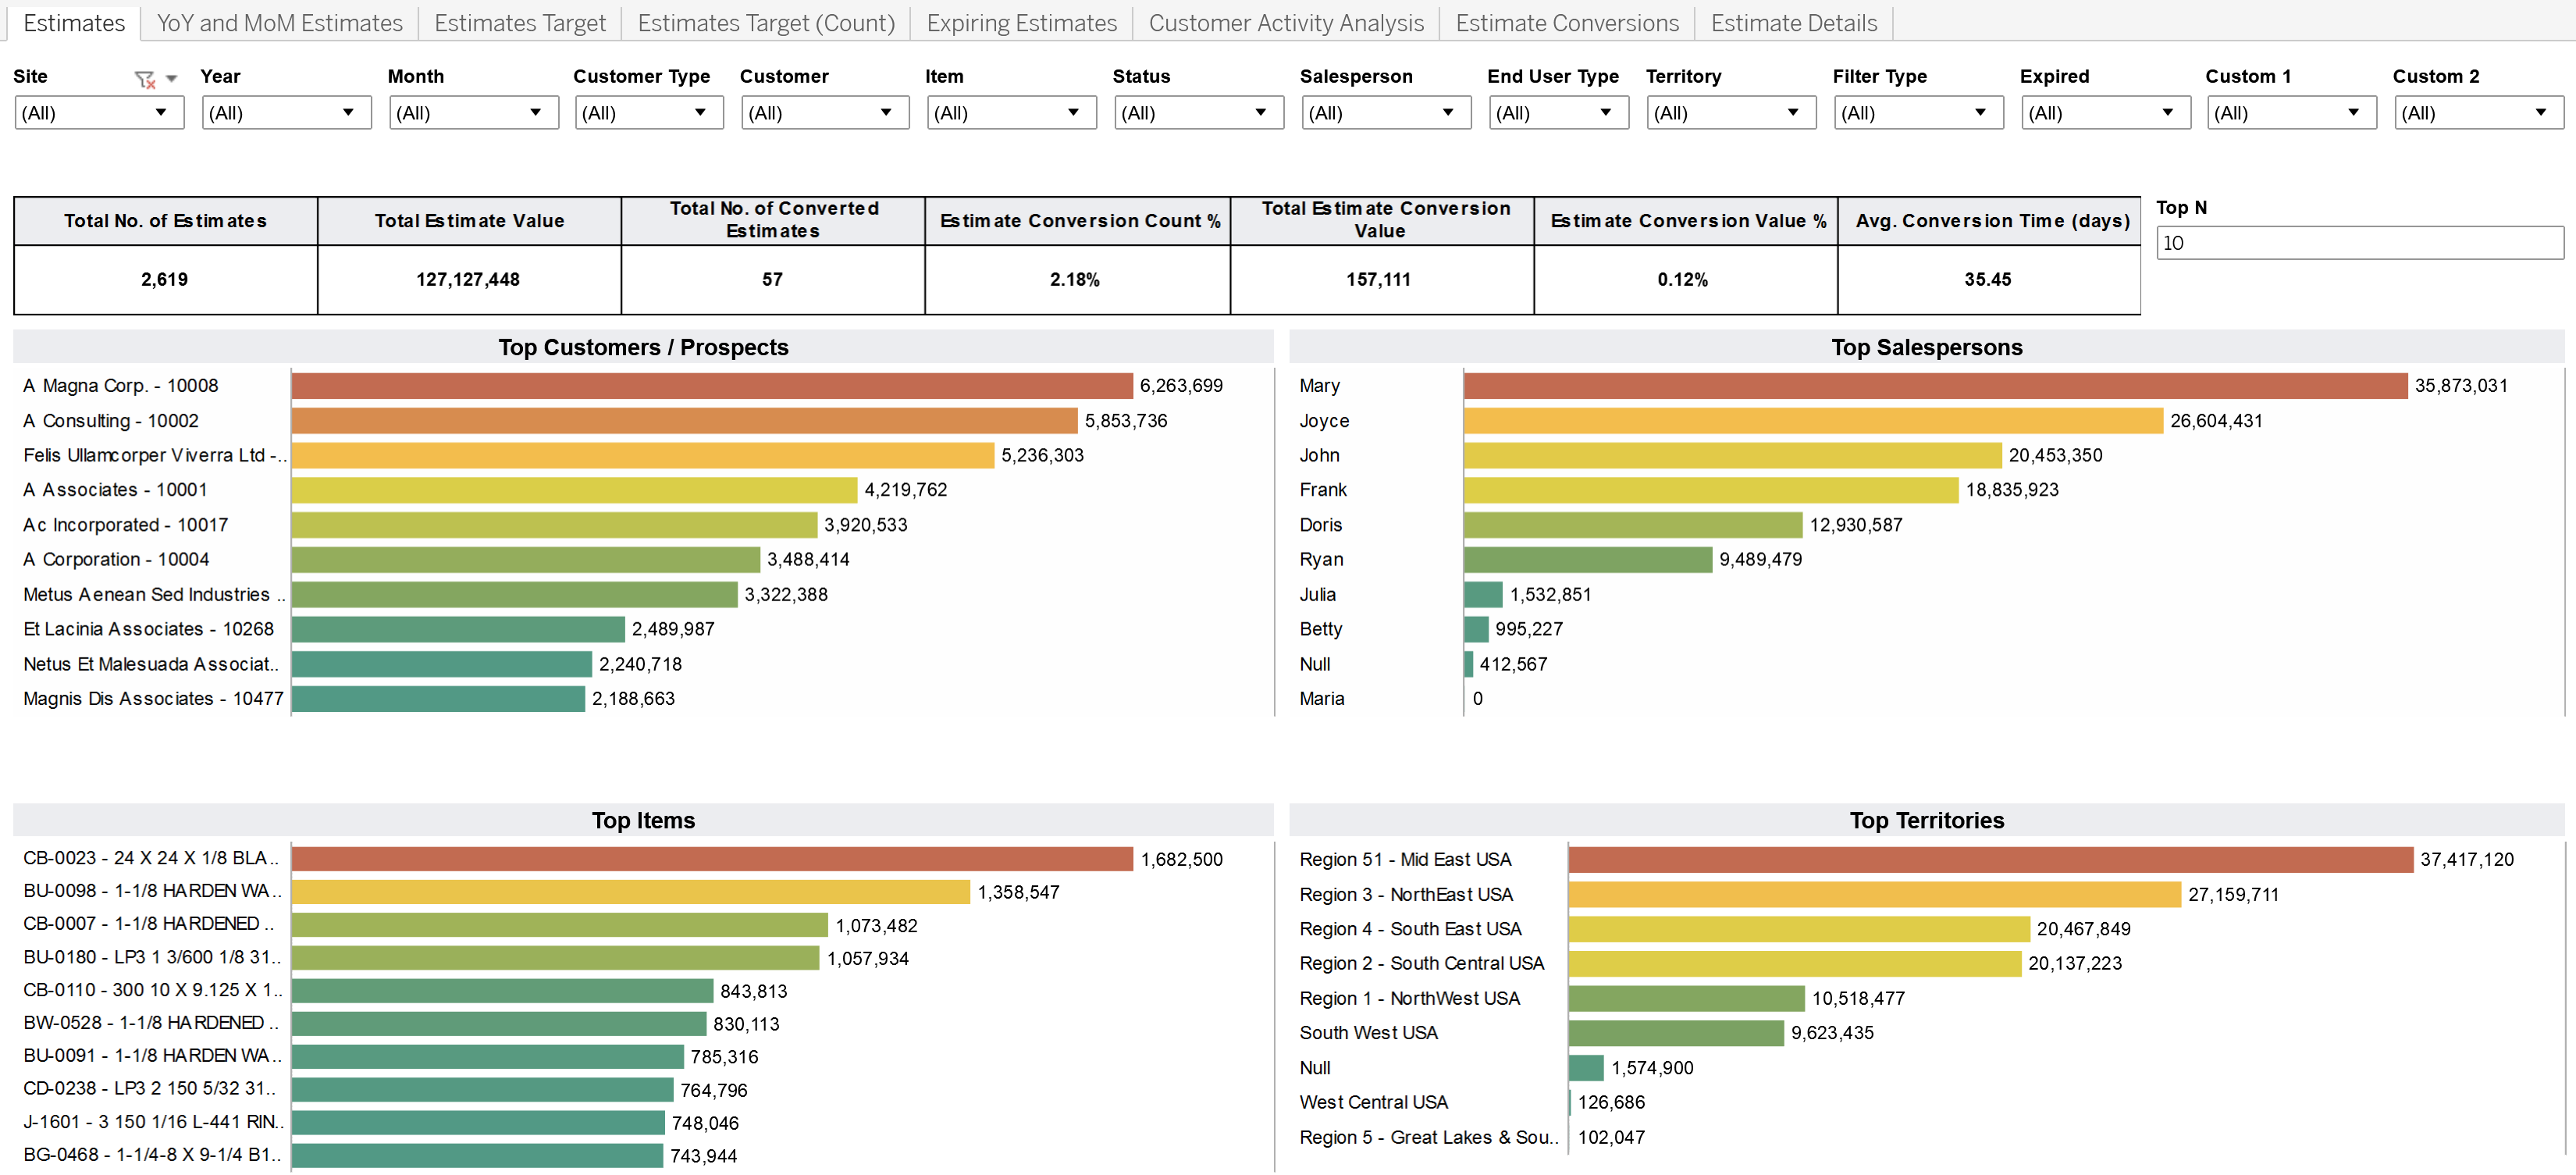
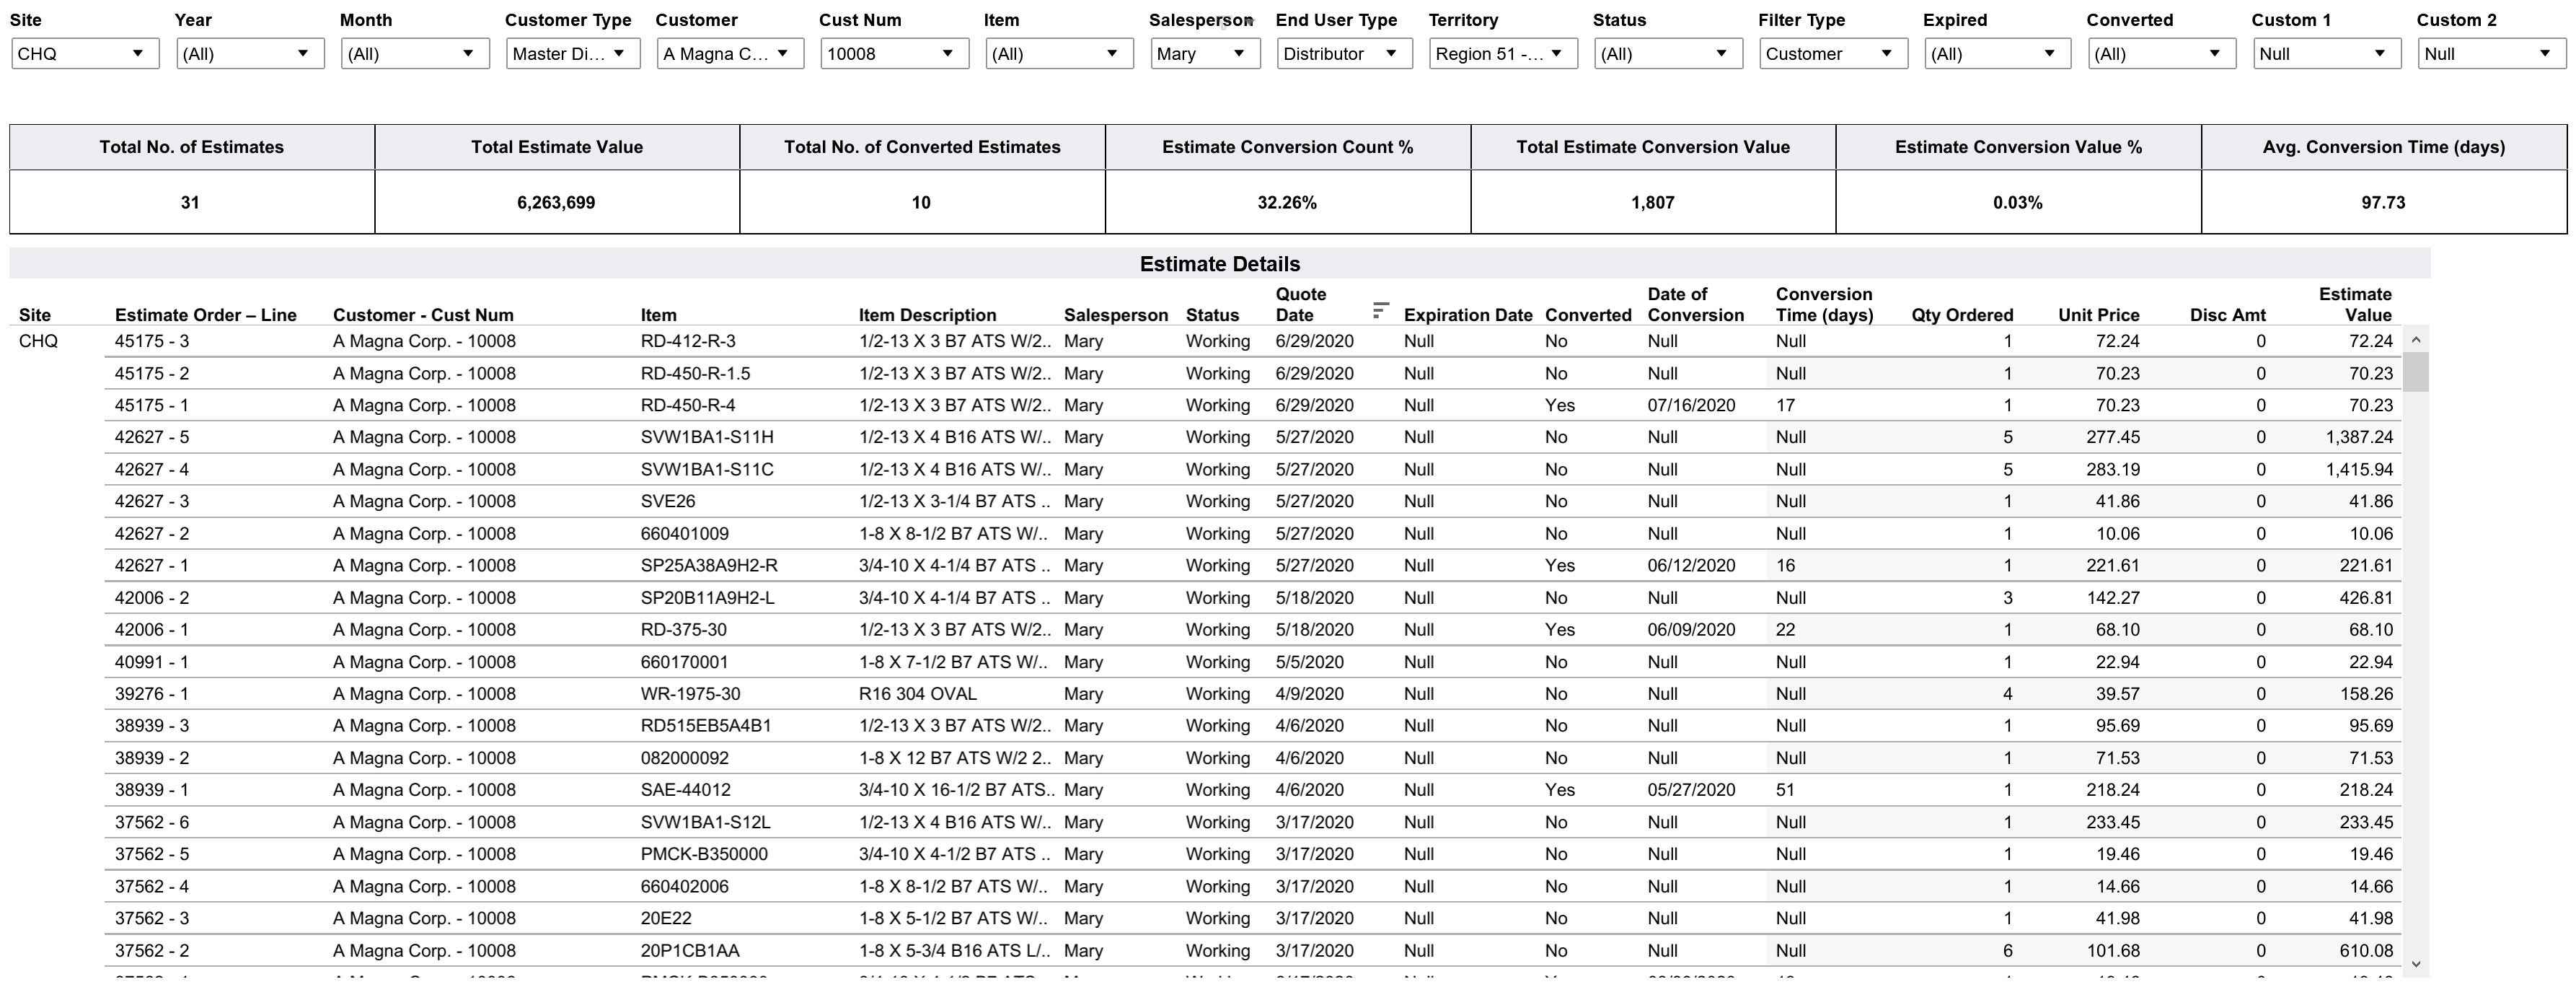
Within each of these graphs, clicking on any of the bars will take you into a drill down of the data that makes up that bar. Above by clicking on the first bar in the Top Customer graph will display as below the detail for the Customer: A Magna Corp. as shown below in Figure 3. The data below is sorted by Quote Date from most recent to oldest.
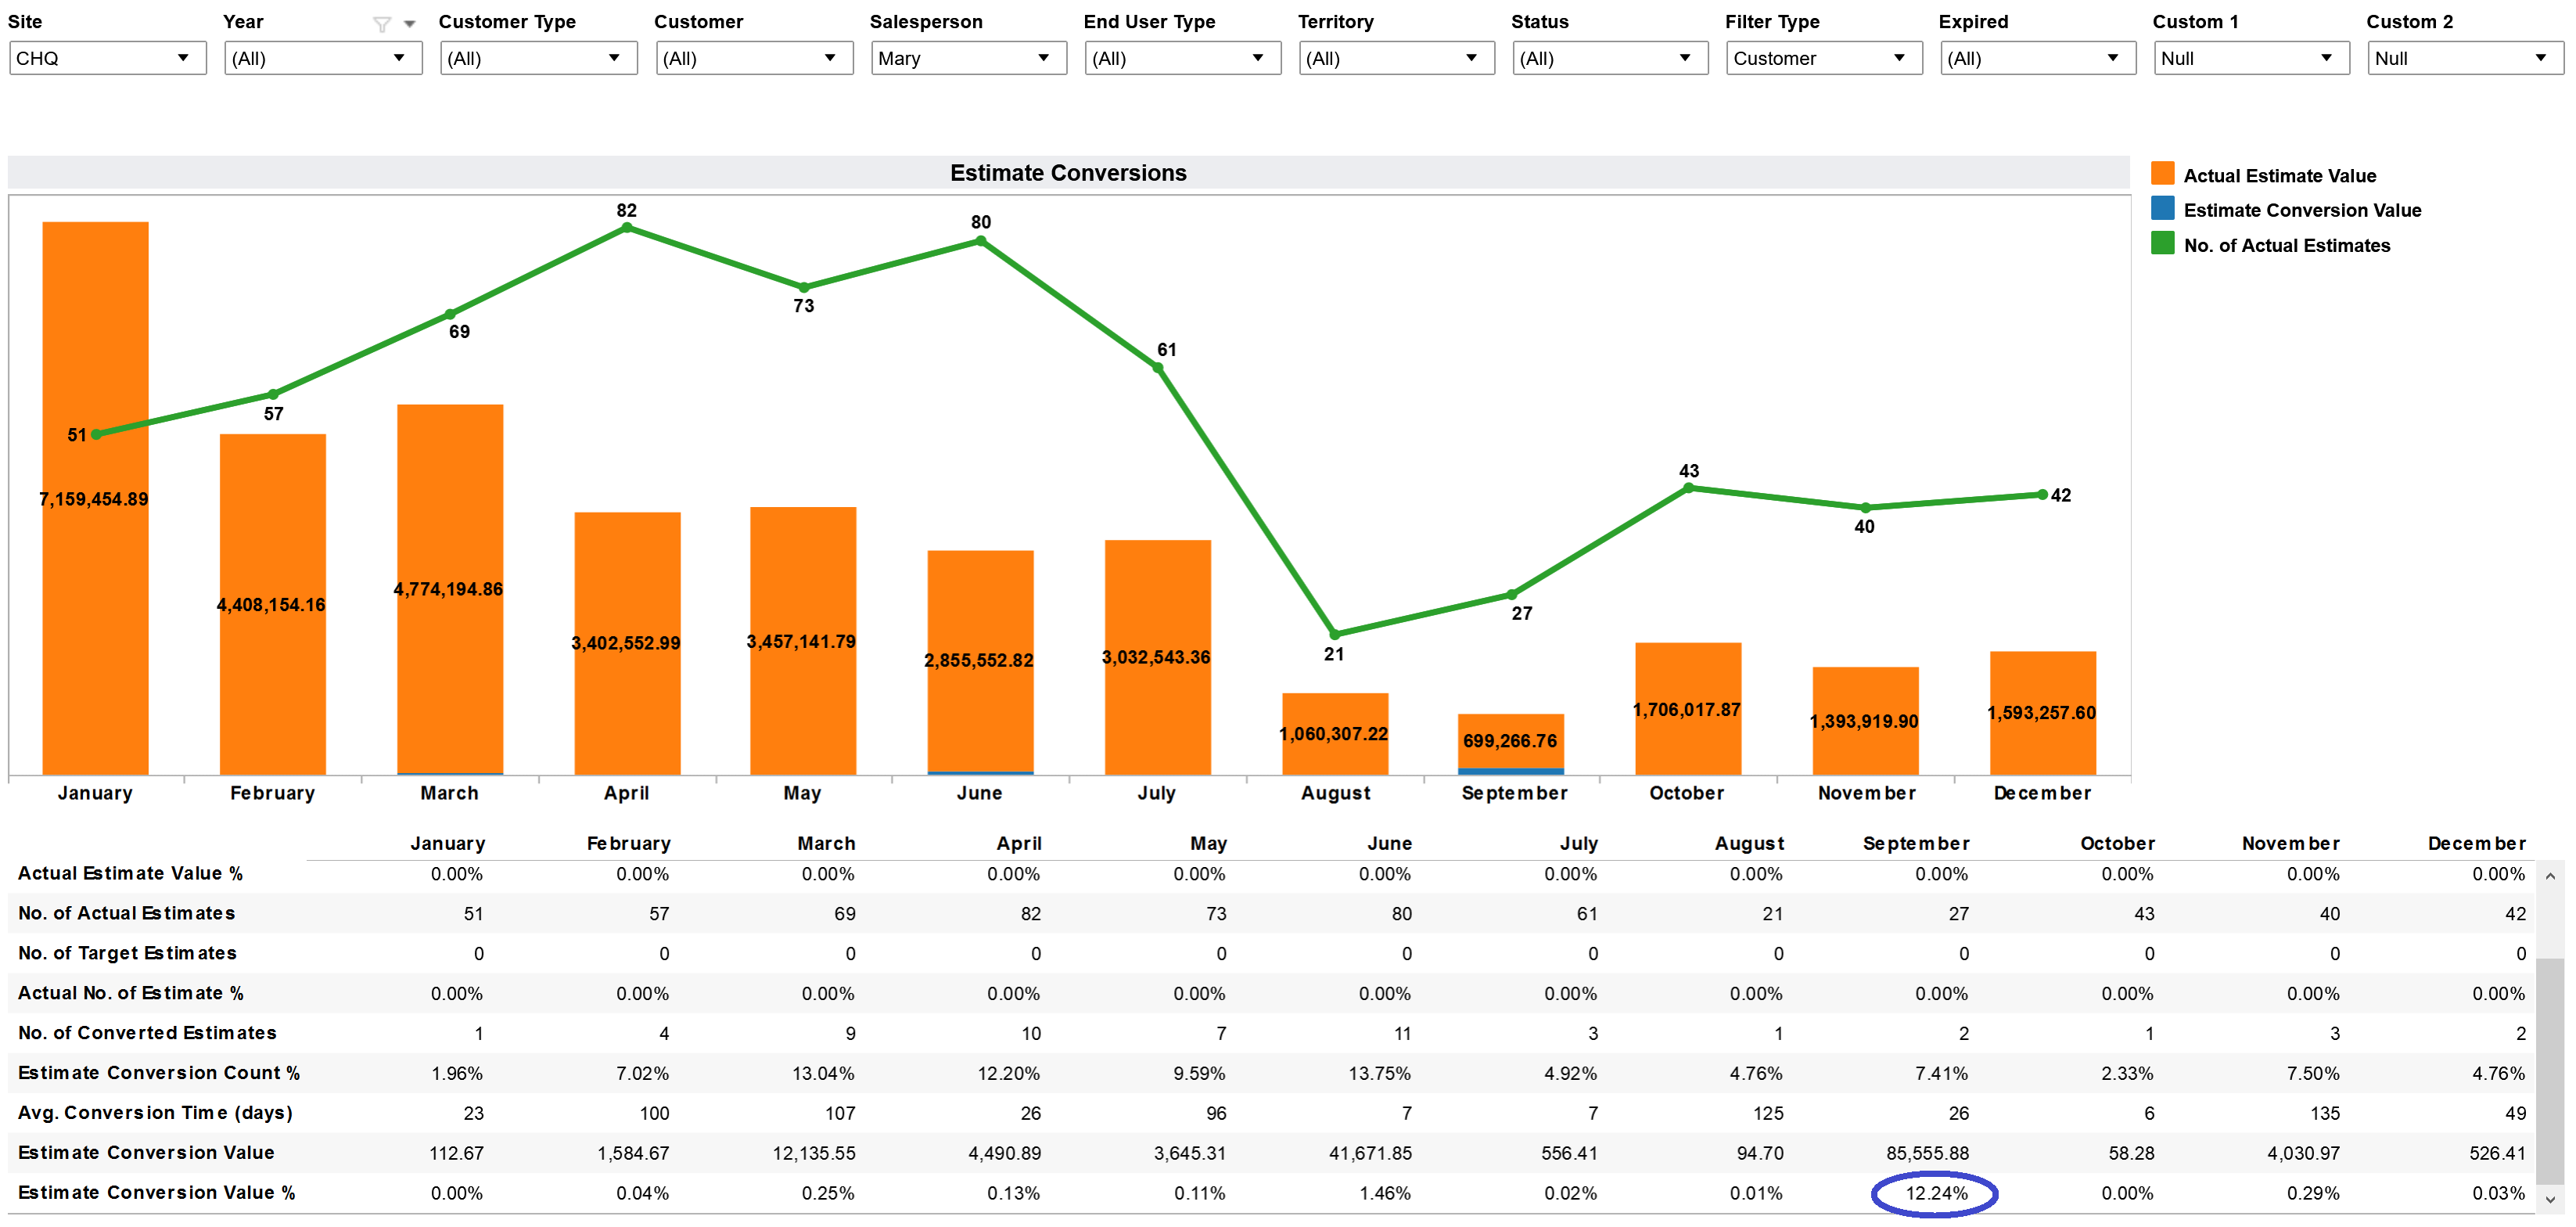
#3 Estimates Converted to Sales
Once estimates are provided how well does a Salesperson and the organization convert that from an Estimate to an actual Sale? In Figure 4 below we can see a visual look at the number of Estimates, the dollar amount of those Estimates, and the dollar amount of those Estimates that have been converted to Orders. The data below is revealing in that most estimates do not appear to be rolling over into actual Orders. The month on September shows about 12% of the Estimates value are being converted into actual Orders and Sales. The rest of the months of activities do not provide enough Sales to even register as an amount on (i.e. blue bar) the graphic. Clearly in such an environment the Sales Organization would need to focus on not just providing Estimates, but converting a larger percentage of those into actual Sales.
#4 Aging of Estimates and Customers
How well does the organization perform by staying on top of Estimates that have been provided? Does the organization stay in contact with prior Customers especially ones that may not have any recent transactions? In Figure 5 below we have a tabular view of Customers sorted by the Last Order Date. This is one way for the organization to look at Customers and determine which Customers may have bought from us in the past, but are no longer buying from us?
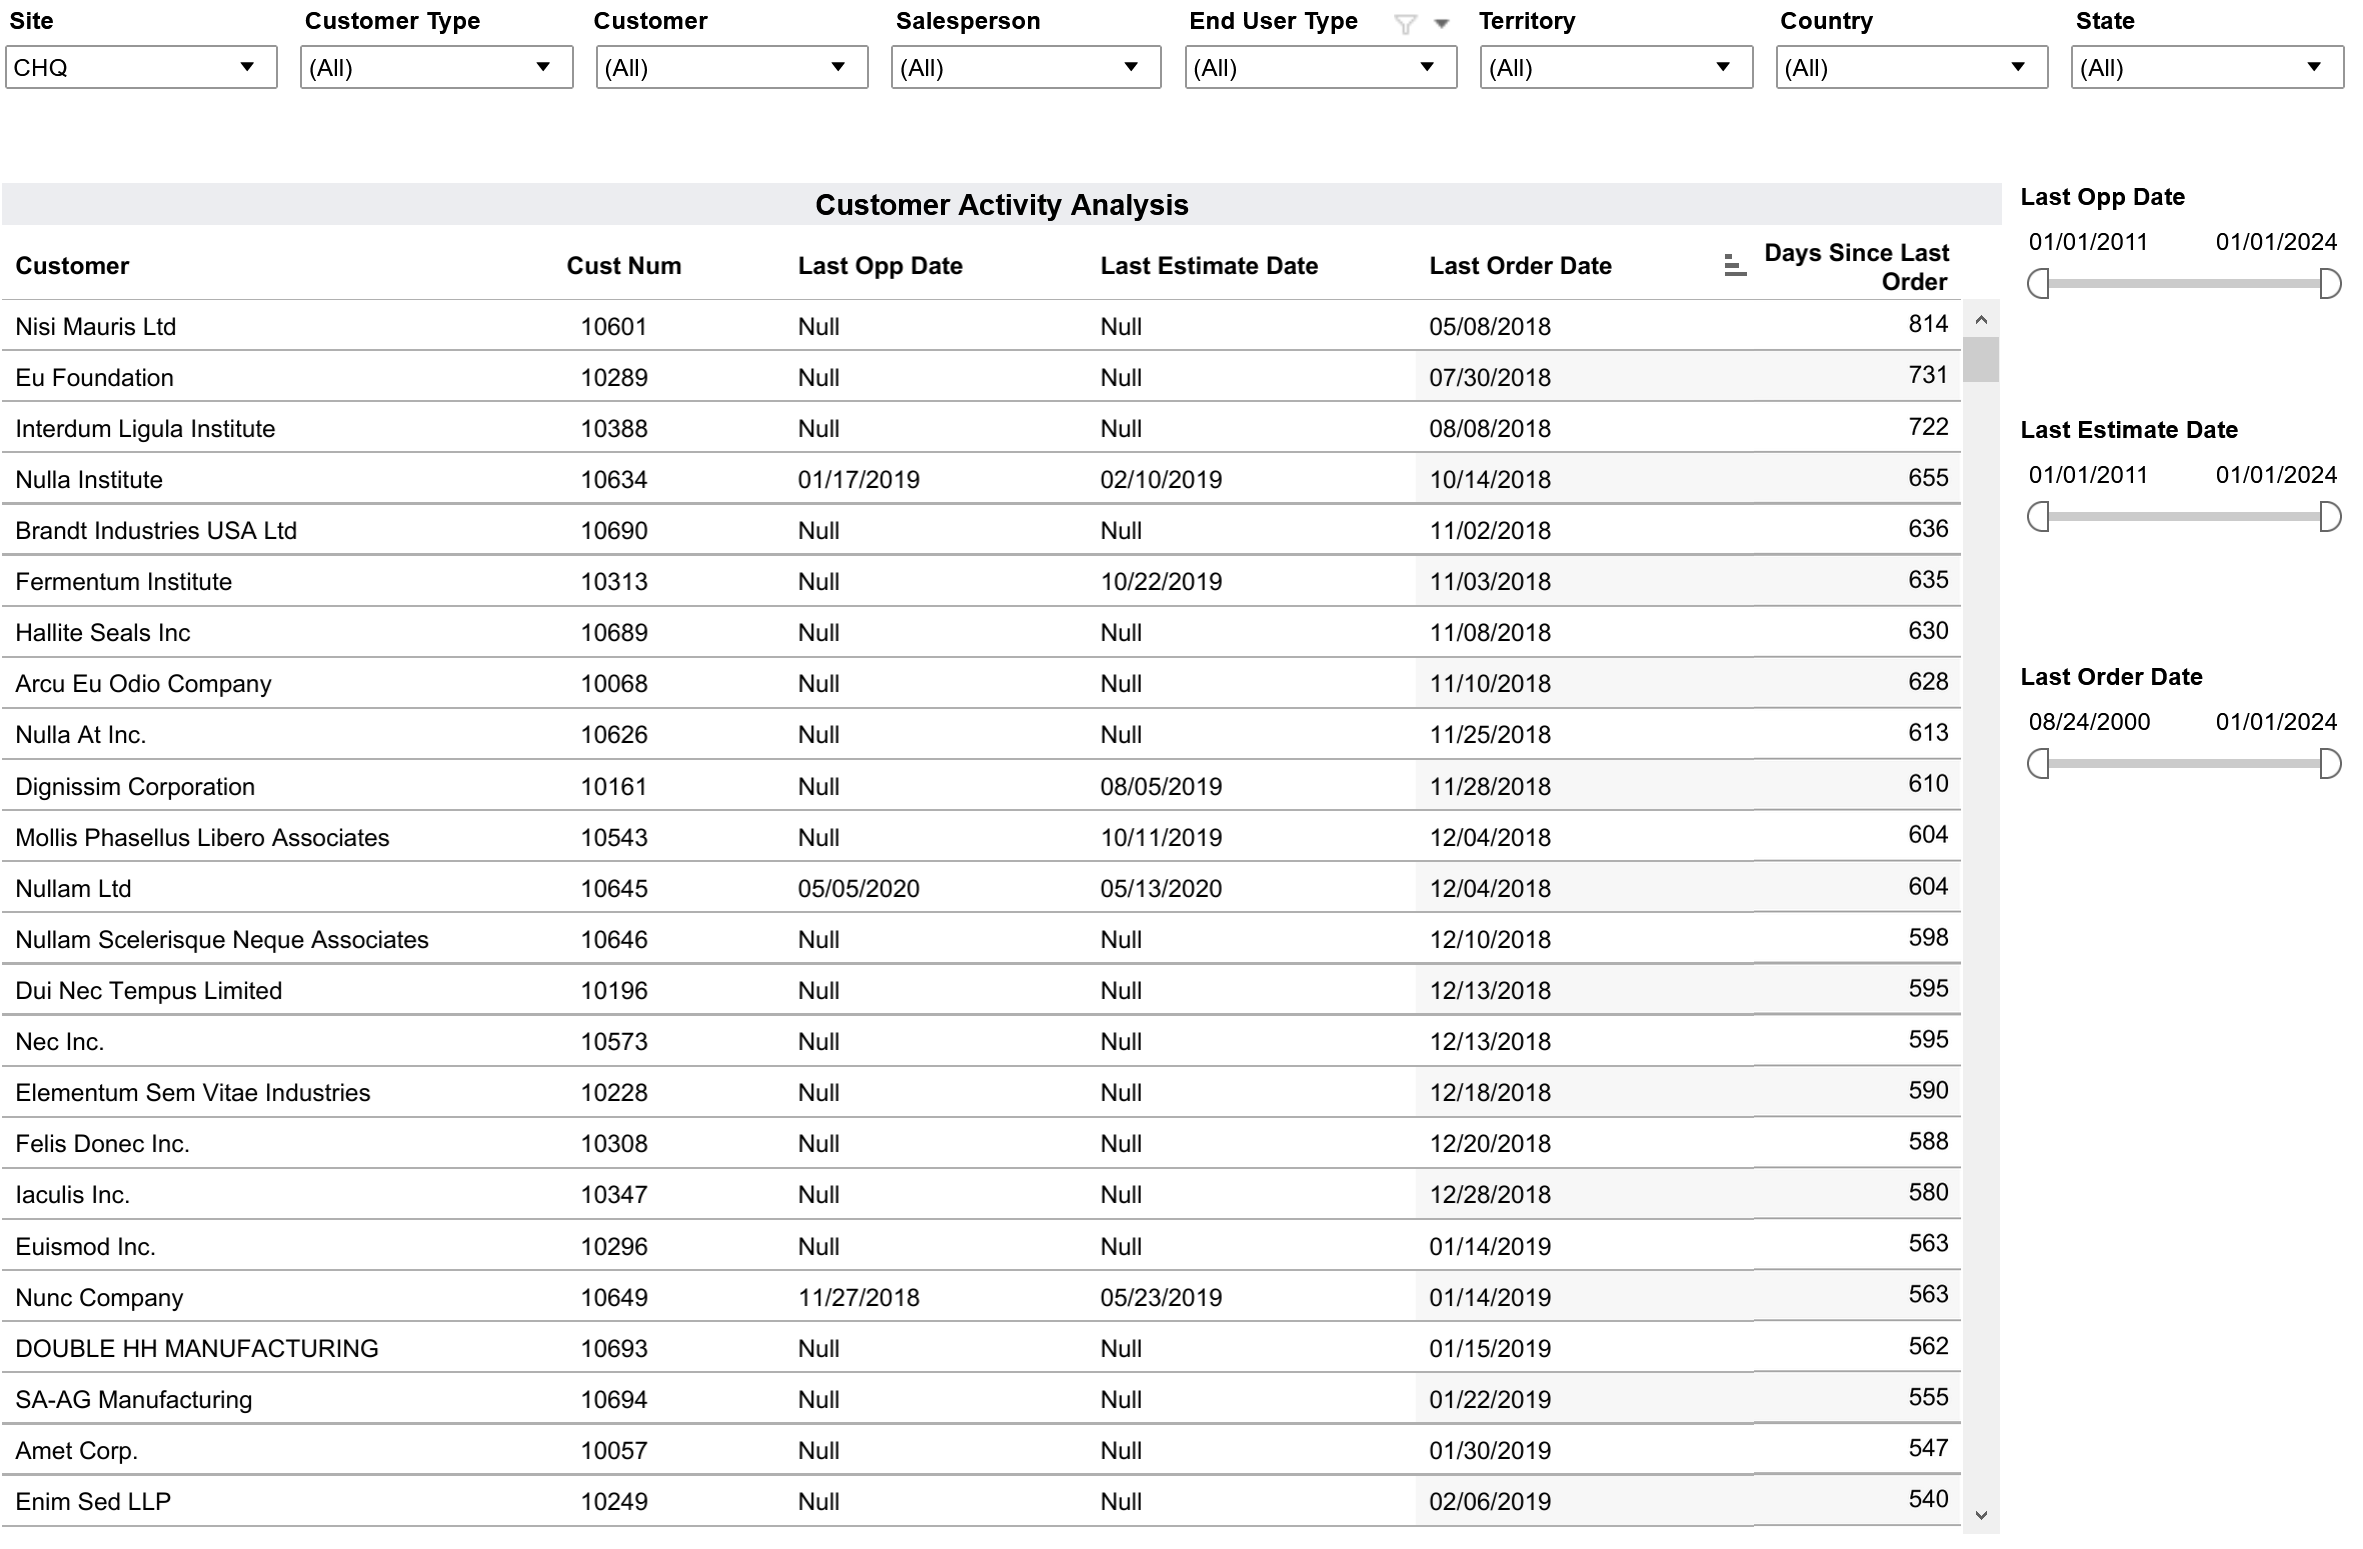
The data displayed in Figure 5 above can be filtered by a variety of criteria such as Salesperson, Territory, Customer Type, Country, etc. In this way an organization could target specific Customers that may have grown stale and need to be called on by Salespersons to perhaps generate new Sales.
#5 Overall Sales vs. Targets
How well is the organization doing in generating Sales vs. the Sales Targets that it sets for itself? Is it meeting those Targets? Targets are a very important metric to look toward as the Targets are often determined based on what revenue the organization needs to bring it to support its cost structure. If Sales Targets are not being met then that has implications for the entire organization. Below in Figure 6 we can see a look at Sales vs. the Sales Targets for a specific year (in this case a prior year). Very quickly the Sales Organization can see how they are doing on a month by month basis.
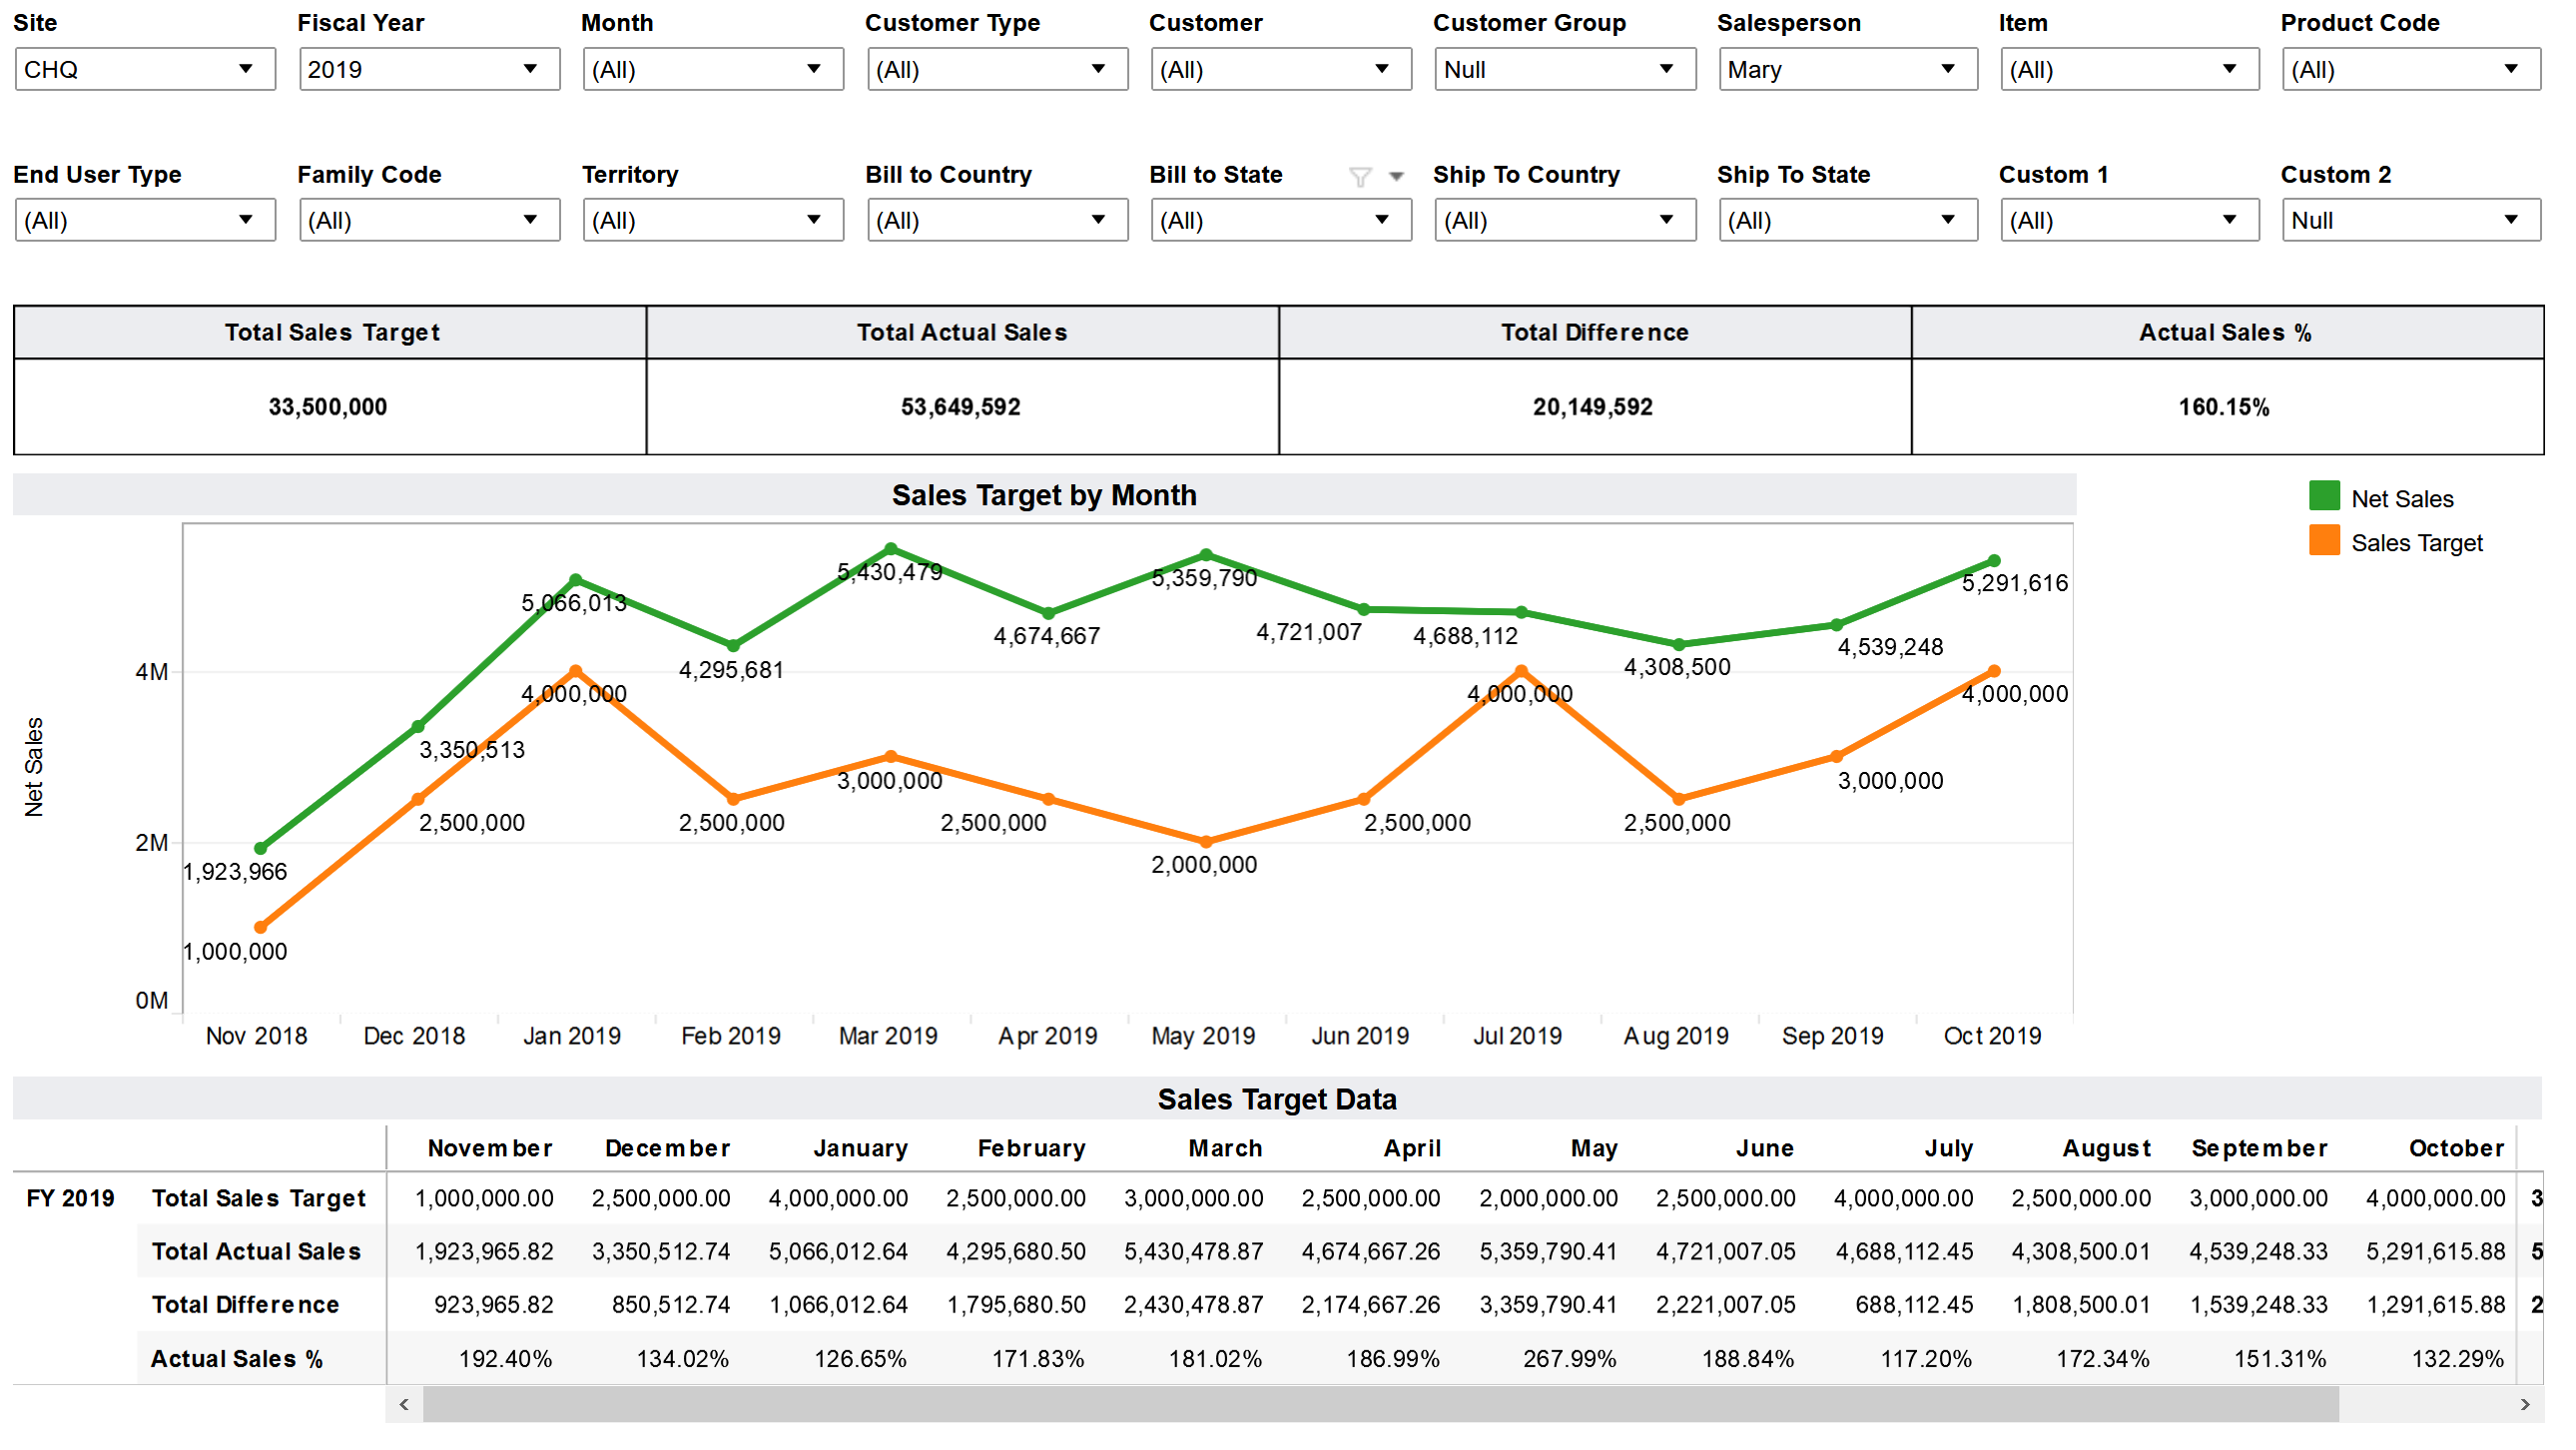
In this Analytics view the user has the ability to also filter by a plethora of different criteria such as Salesperson, Customer, Territory, Product Code. etc. This capability enables the Sales Organization to organize and view the data in any number of different combinations and thus analyze how Sales are actually performing.
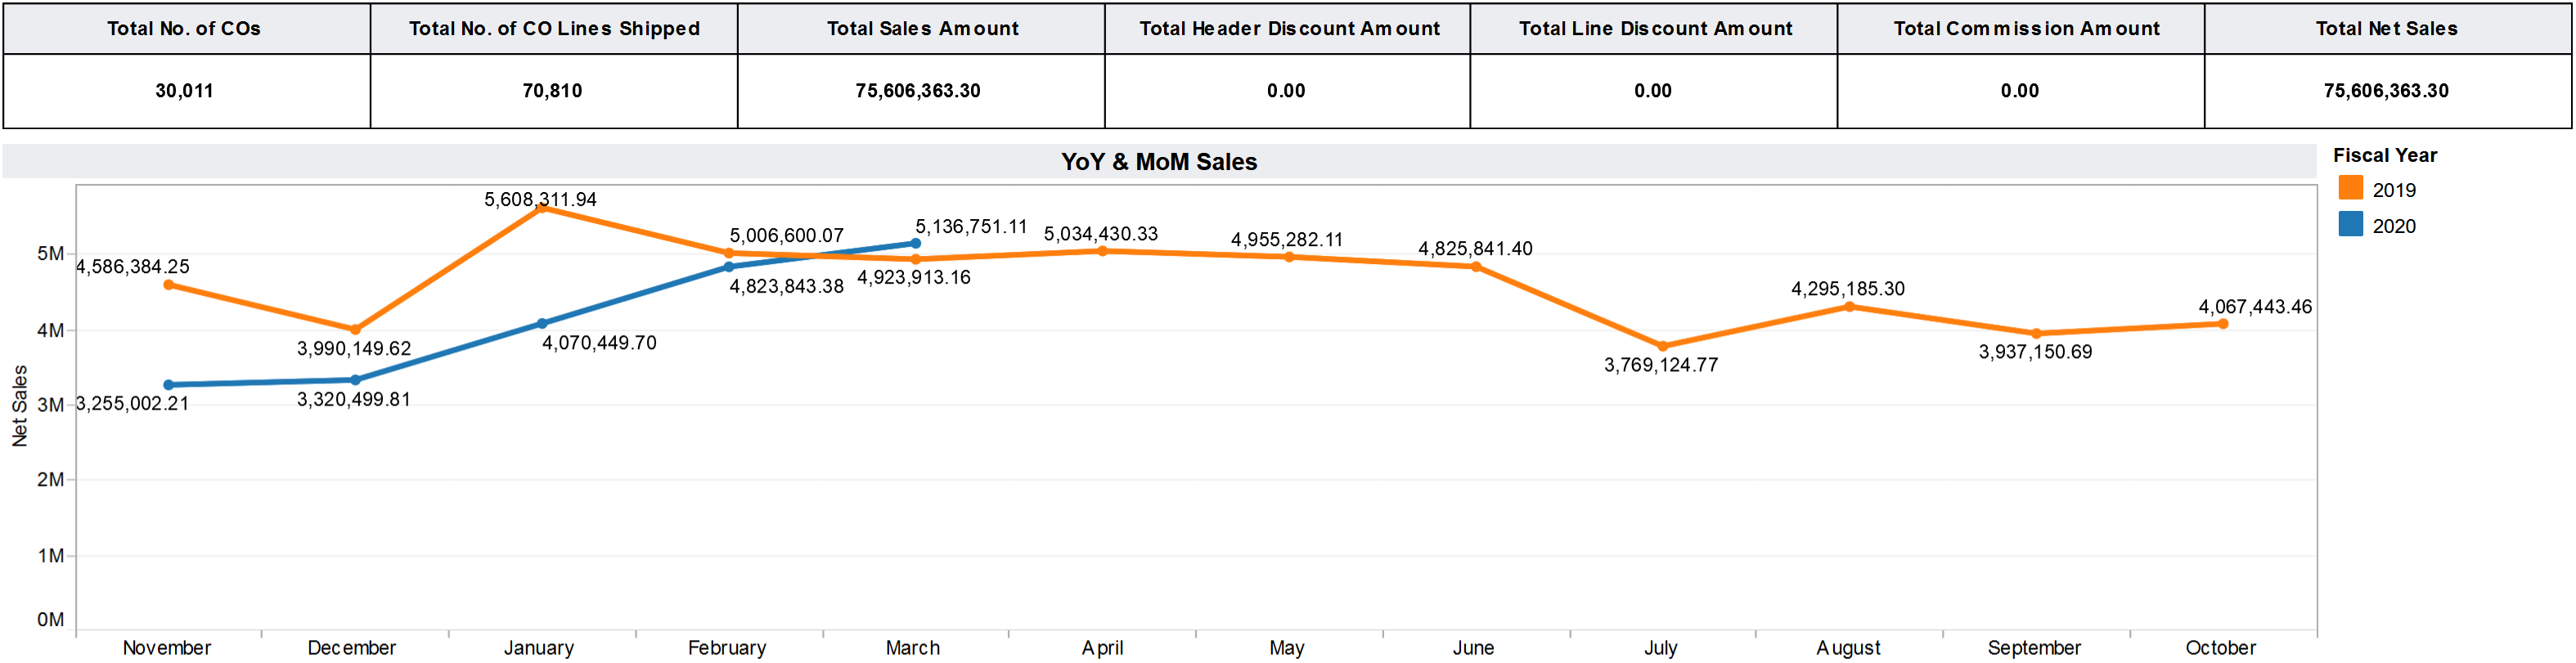
Another often valuable in Sales is to understand how Sales compare to a prior year. Below in Figure 7 yet can see this comparison for a Year To Date Sales in the current year vs. the prior year. This is an oft requested metric from Sales Management. As in Figure 6 above the data is this chart is also filterable by multiple criteria.
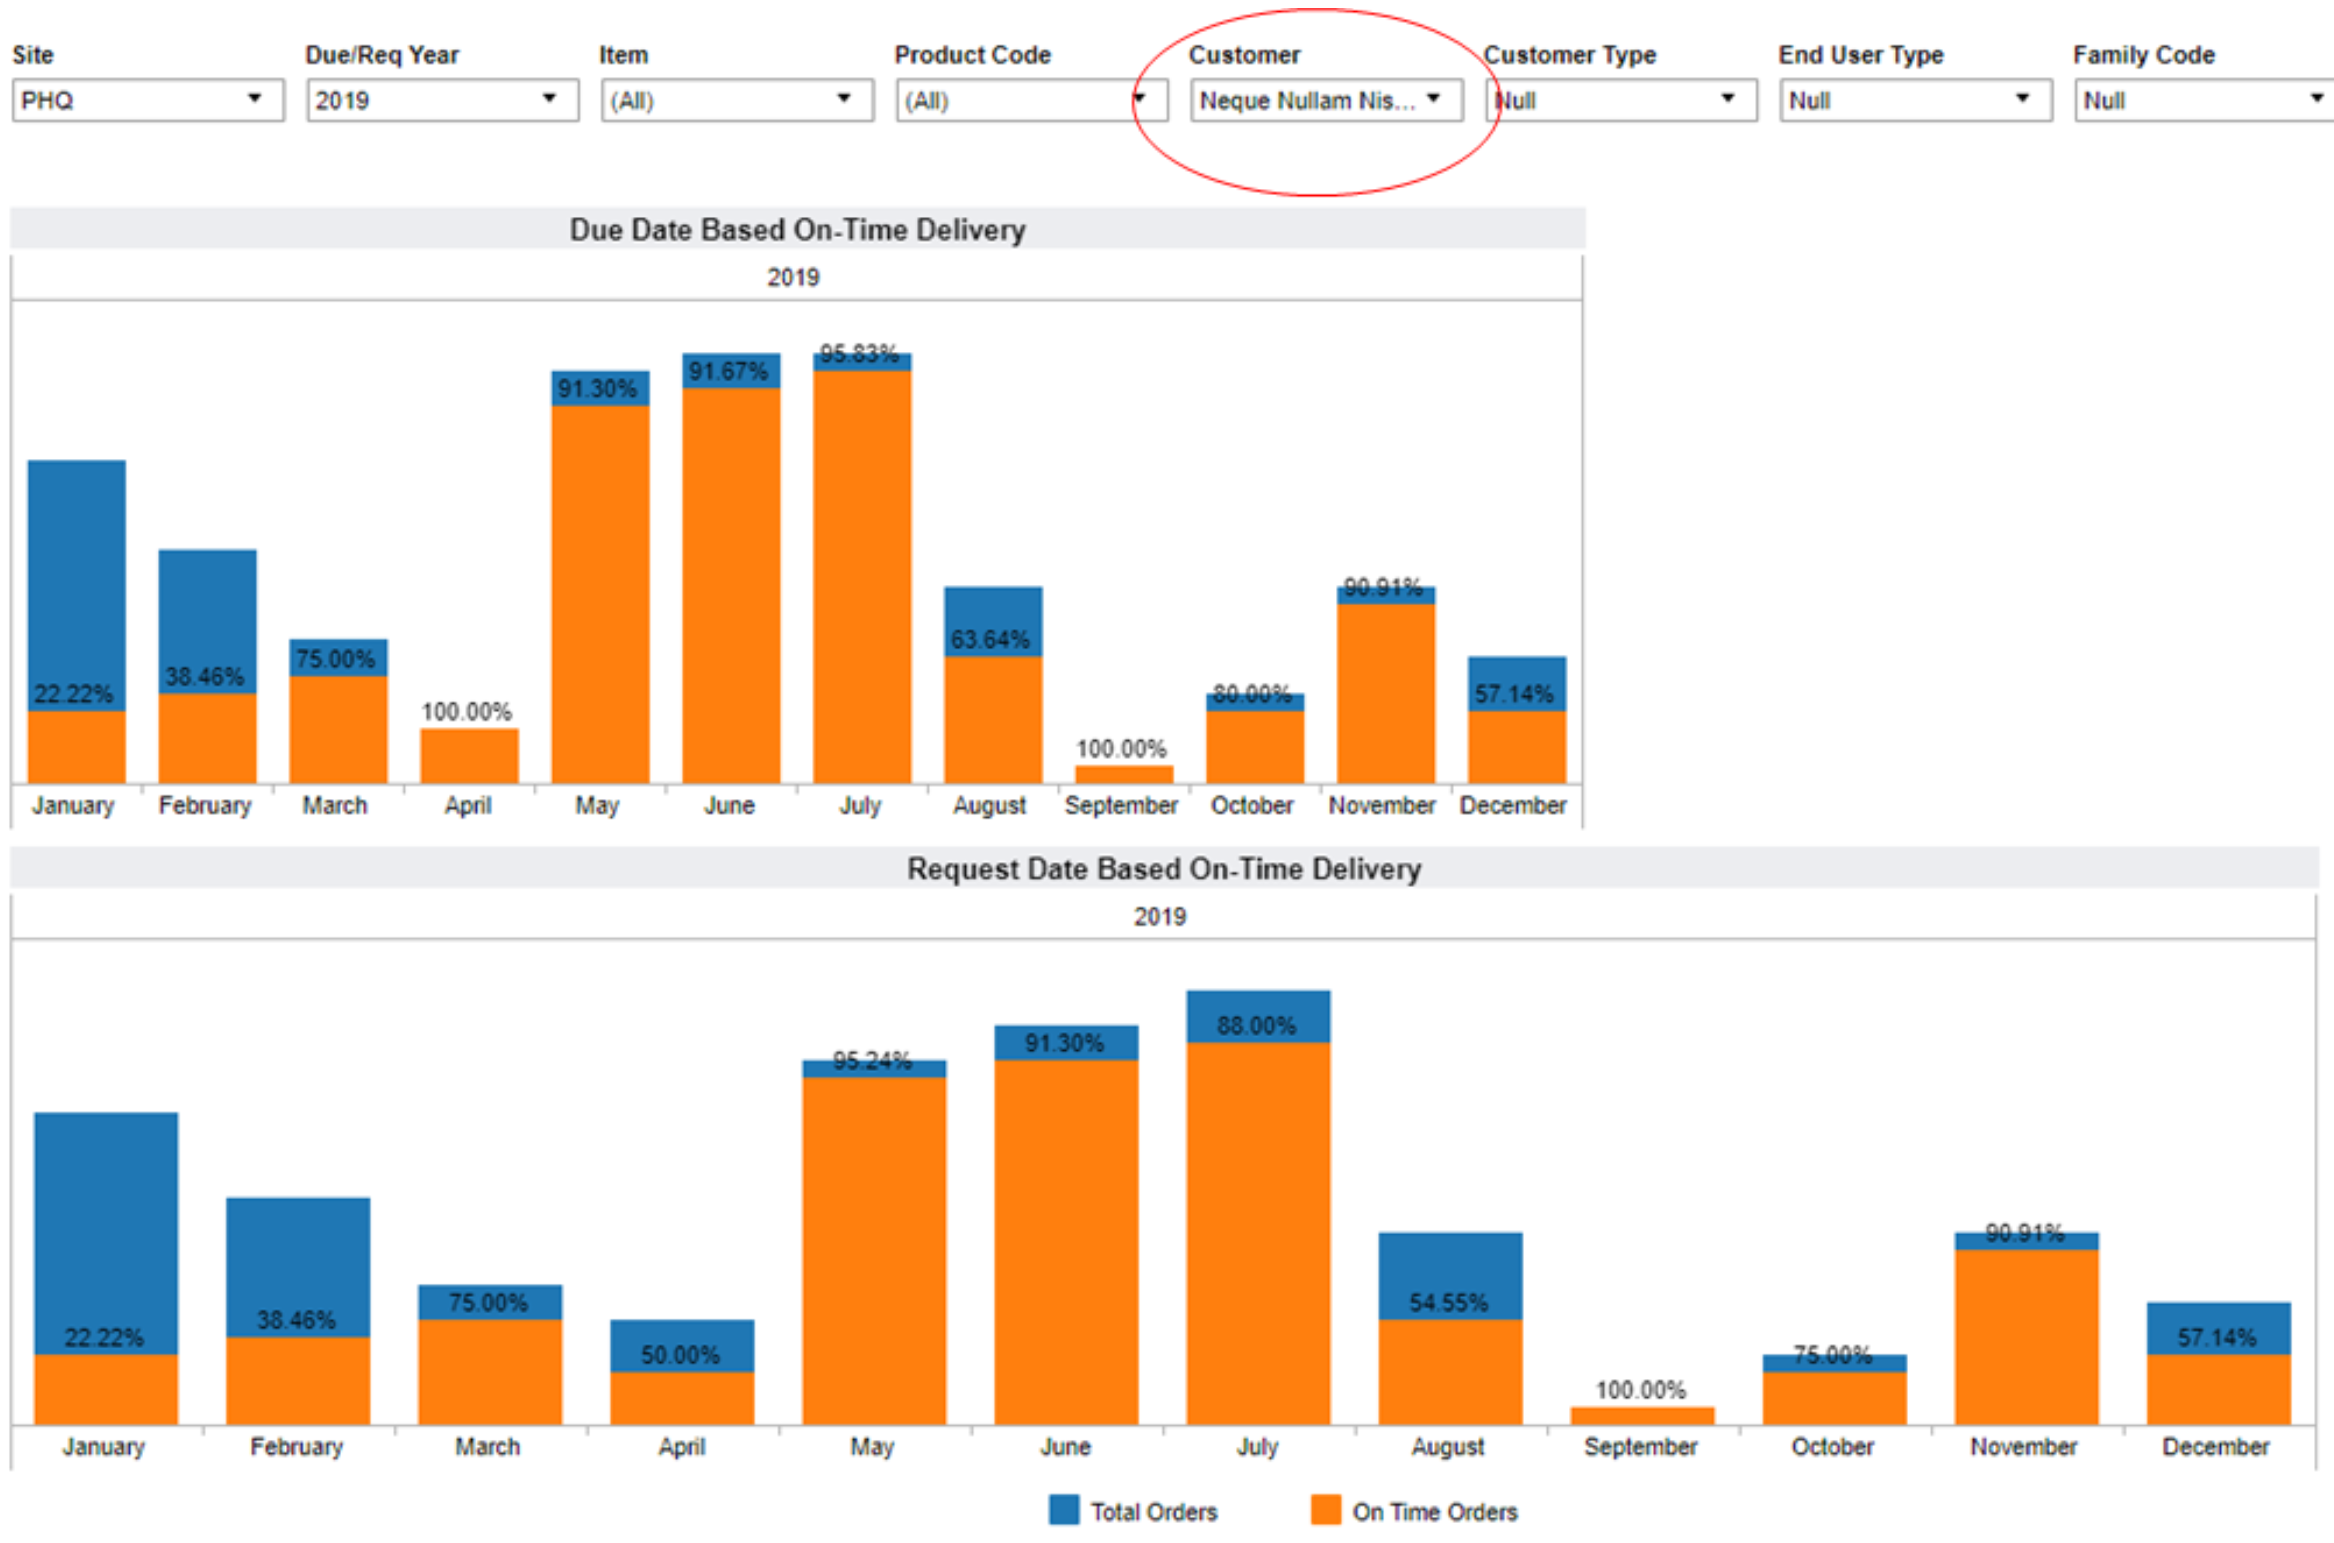
Another metric that organizations like to understand is once a sale has been made to a Customer how well is the organization actually doing in delivery what the Customer has ordered by the Date Due or by the Date Requested? Below in Figure 8 we see a view as to how well the organization is doing on meeting its deliveries for a specific customer (Neque Nullam) in a given year by the Due Date and by the Customer Request date. Having this type of data can help an organization understand and address issues that may arise in delivering on its promises to Customers.