Table of Contents

ERP Data In But What Comes Out?

Facebook
Twitter
LinkedIn
Email
WhatsApp
ERP Data In or Out

Overview

The reality of any IT system, whether it be an ERP (Enterprise Resource Planning) system or something else, is that the data the system captures, stores, aggregates and manages is more valuable than the software.  This should not be a unique revelation exclusive to IT systems as it is mirrored in other physical systems as well.  Consider the average electric utility, as a user of their services you want the electricity they provide, while the wires, poles, transformers, etc. are important, ultimately it is the electricity they deliver to you that ultimately you value, and so it is with data in your ERP system.

There have been a number of approaches applied to valuing data.  The IT industry analyst firm Gartner, Inc. has said that organizations will ultimately be valued based on their information portfolios and not on the more traditional accounting assets.  It is not hard to see this reality played out in today’s business world as the 5 most highly valued US based companies are all organizations whose business model is built on data and information (Microsoft, Apple, Amazon, Alphabet, Facebook).  

This concept applies in every business, and one of the primary stewards of that data in your organization is your ERP system.  So if it is the data in your ERP system that represents the real value of your ERP system, what are some characteristics of that data, and how might your user community want to access or display it?.

Extracting the Value from Your ERP Data 

Most business users want to access the data in the ERP system in a way that is easily understandable and is decision-ready.  The following characteristics often apply in how a user wants to see and access the data from the ERP system:

  • Data access and usage is based on job function.  A manager will often want to see data specific to their department and employees.  Higher level managers need to see data that is summarized or aggregated across the entire organization  
  • Data needs to be selectable or filterable based on a specific business issue being explored
  • Data needs to be time based to represent the immediate or some relevant date in the past.  
  • The data needs to be self-evident as the one accessing it may not know in advance exactly what to look for or what issues the data illustrate.
  • The data may need to be viewed via several different dimensions in which the column and row attributes are selectable 
  • As the data is presented, it may be summarized, but the ability to “drill down” into it at more granular levels of detail becomes necessary in trying to understand an underlying root cause or problem being identified.

If an organization is going to truly leverage its ERP system and more importantly the data in its ERP system, these characteristics are vital to effectively getting value from that data.  Below we will look at some examples of how this is possible.

Job Function Related

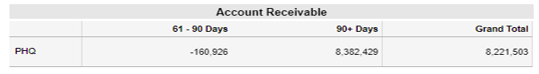
A Finance Executive will want to understand the overall accounts receivable position for the entire organization (see below Figure 1):

Figure 1. Aggregate Accounts Receivable data

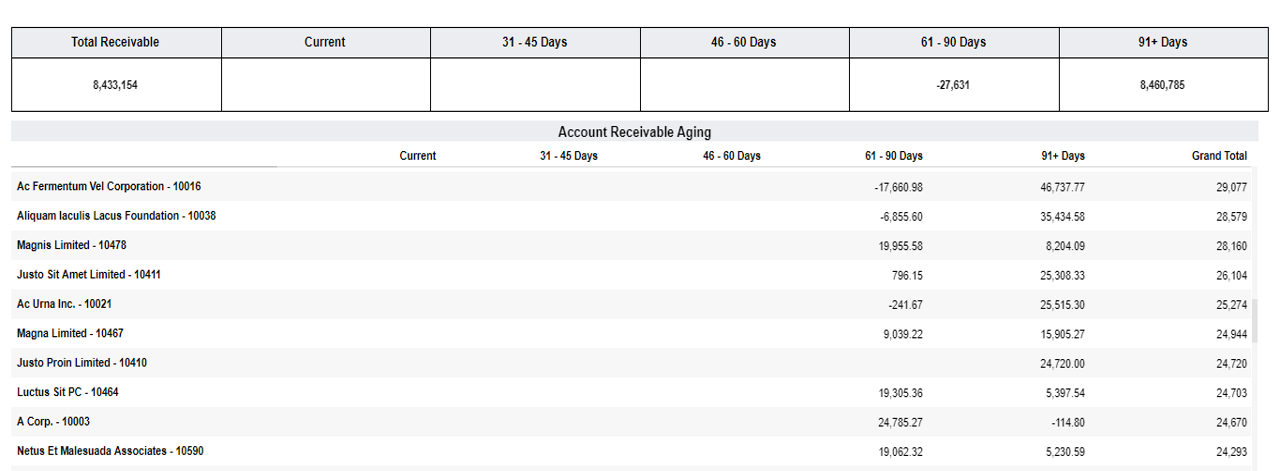
Whereas the manager for accounts receivables will want to understand the details of what is owed from each customer (see below):  

Figure 2 Detailed Accounts Receivable data

Selectable Data

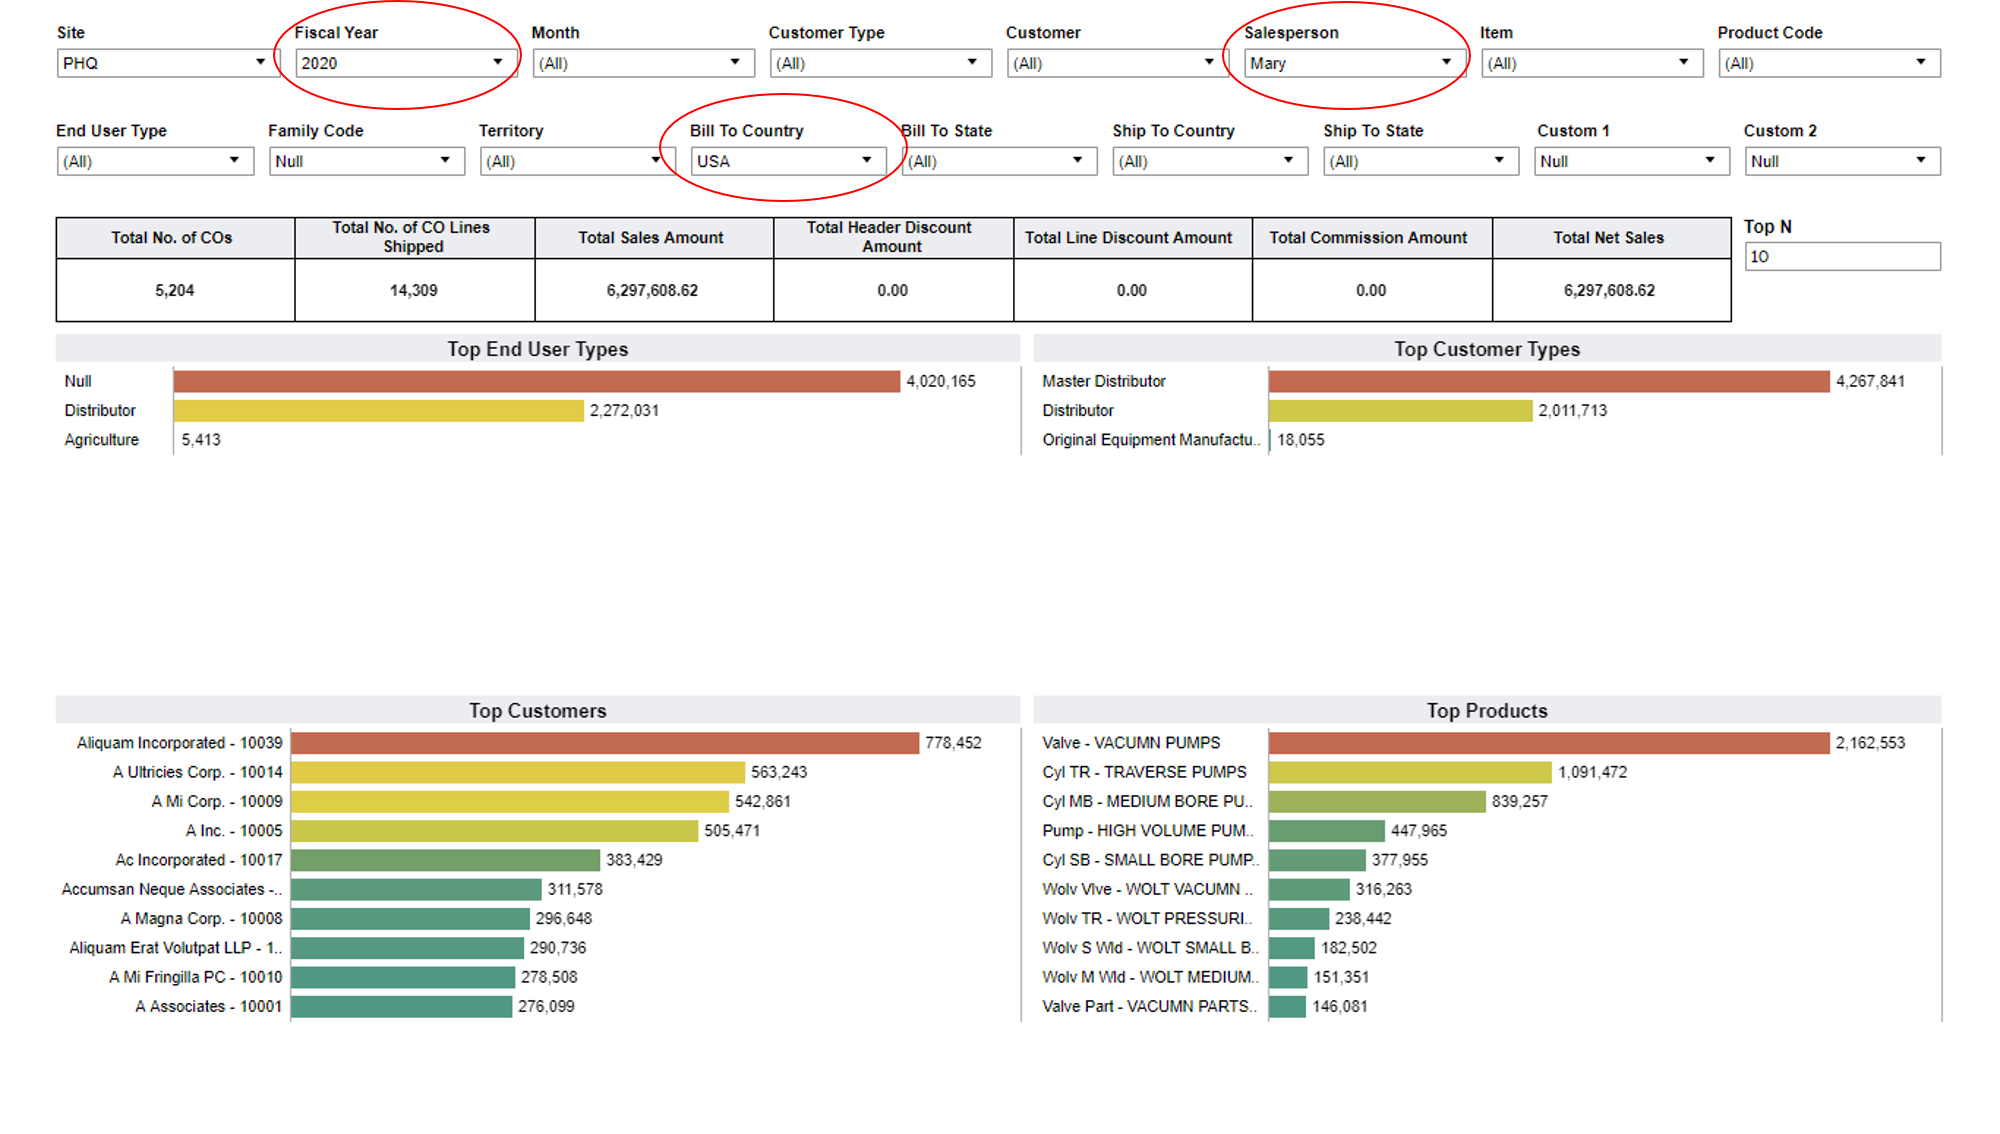
Being able to choose and select data based on multiple criteria allows the person to access the data to see data at a greater level of detail and granularity.  Below is a visual show sales information, with specific selections being made for the year, salesperson, and geography (NOTE: red ellipses)
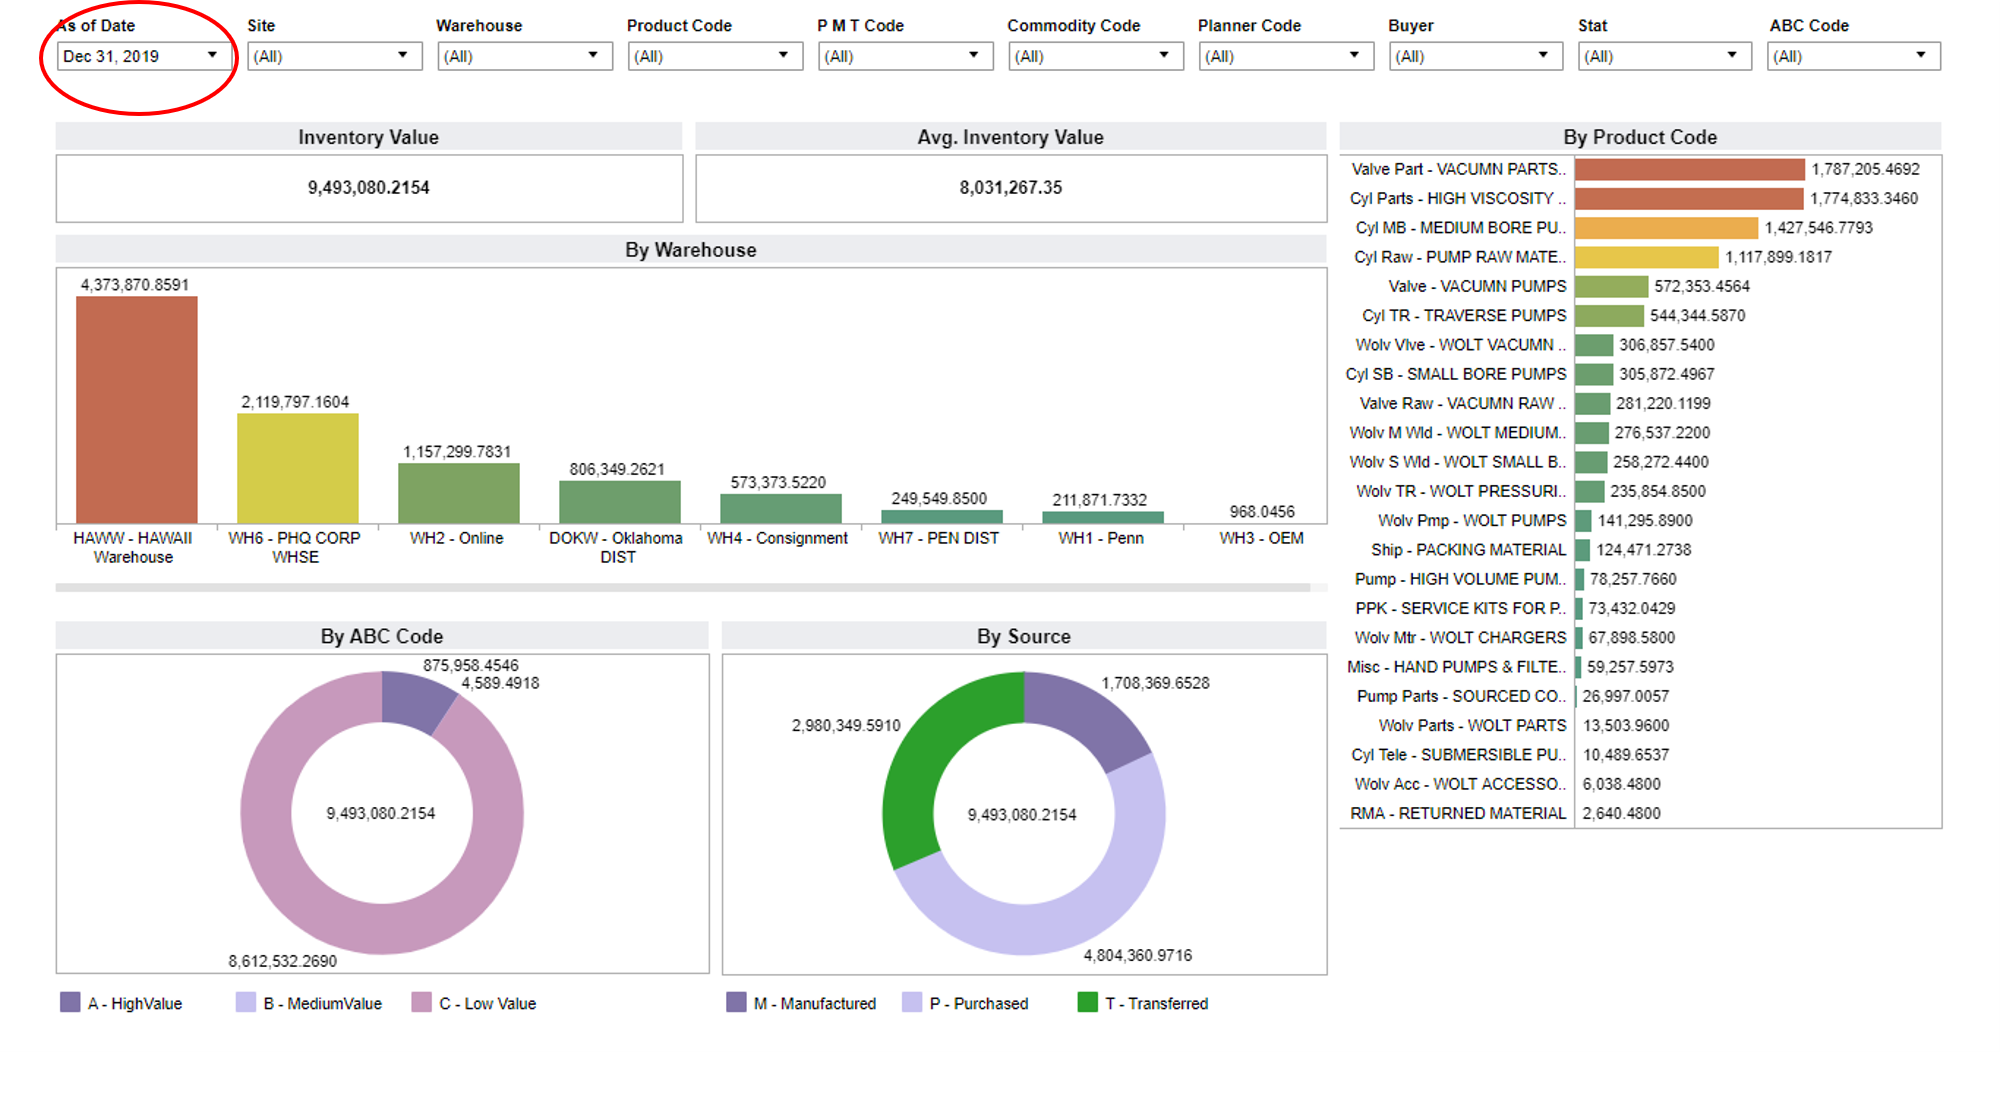
Figure 3 Selectable data

Time-Based Data

Being able to go back in time to a specific date and see the relevant data at that specific point in time is very valuable.  This is often true with inventory data as most ERP systems are tracking the inventory position in real-time.  For many ERP systems, it is almost impossible for them to reconstruct the state of inventory at a specific date in the past.  Below is a view of inventory at a specific date in the past (e.g. Year-end 2019, see red ellipse)
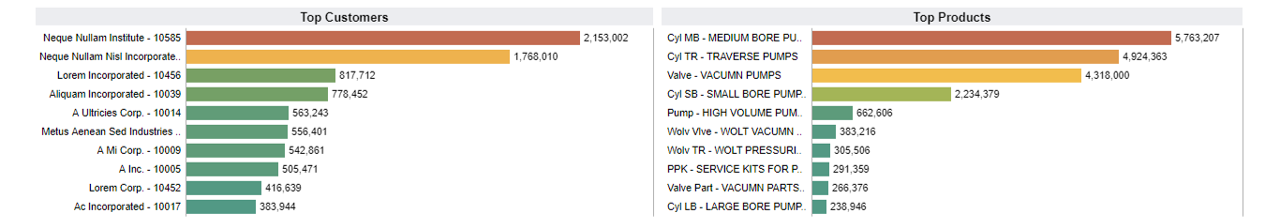
Figure 4 Time Based data

Self-Evident Data

The data must present itself in a way that is obvious.  Below the graphics illustrate clearly who the top customers are by dollar amount and which are the top product categories by dollar amount.  

Figure 5 Self-Evident data 

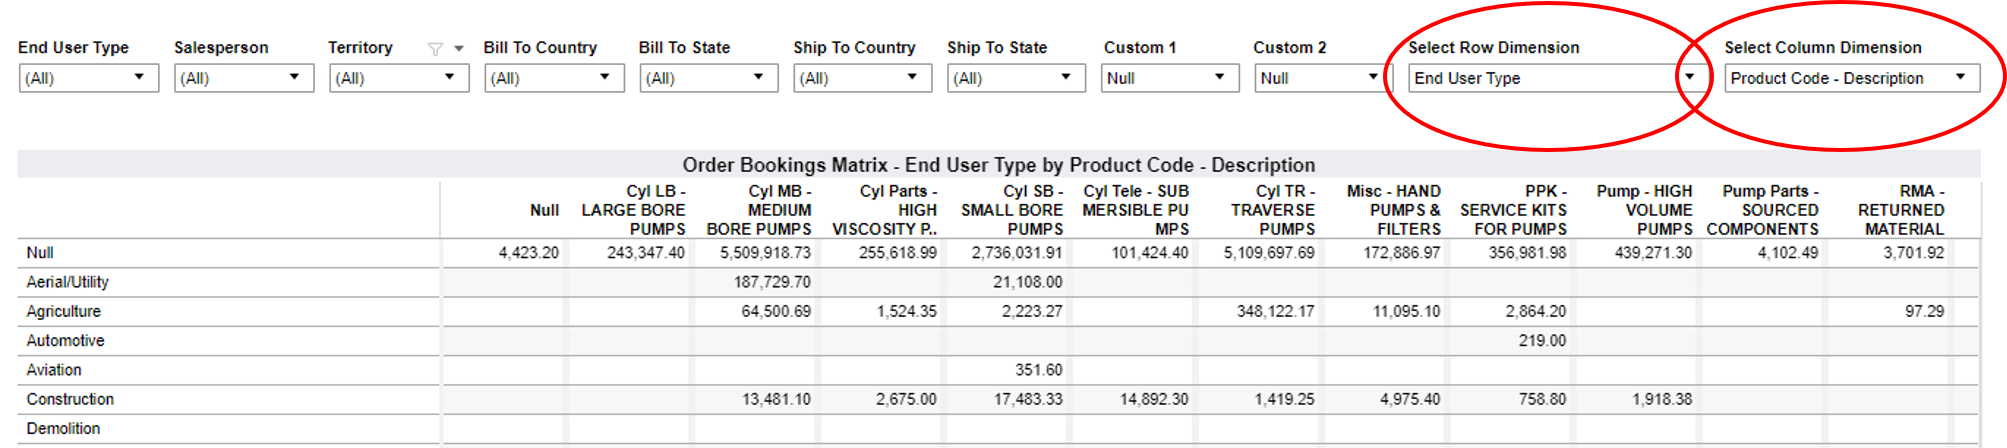
Data Presented with Selectable Multiple Dimensions

The data in the image below is presented with the row as End-User Type and the column as Product Family. (see red ellipses)

Figure 6 End User Type in rows and Product Code in columns

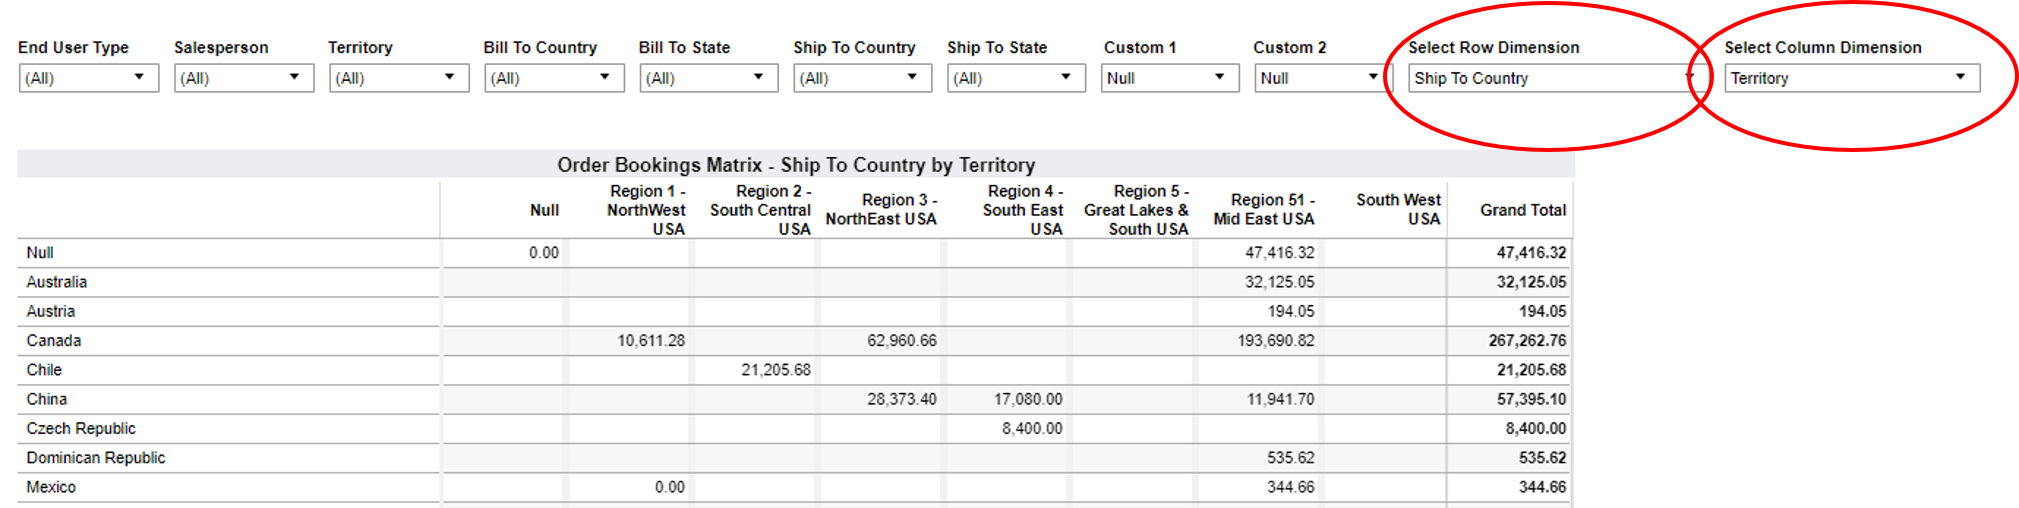
Below the same data is now presented with the row as Ship to Country and the column as Sales Territory.  (see red ellipses)

Figure 7 Country in rows and Territory in columns

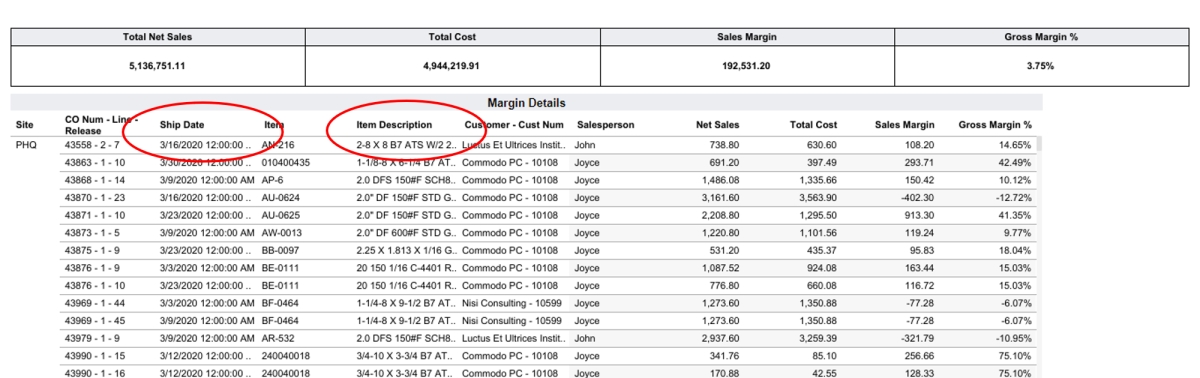
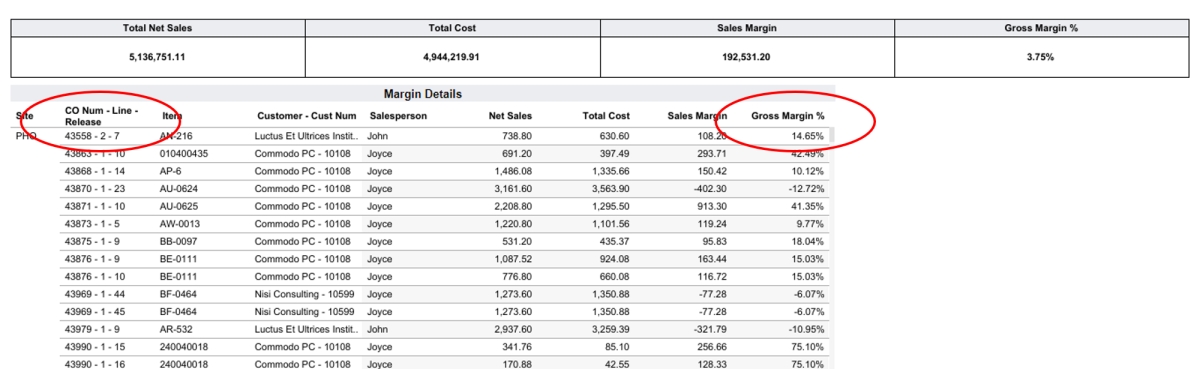
Summary Data with Drill Down Capability

The data should be presented in a summary form that can be “drilled down” if the user needs to see more detail in the data.  The image below shows the Gross Margin % data for sales by Customer Order Number.  (see red ellipses)

Figure 8 Gross Margin % by Customer Order Number 

A drill-down capability allows the data above to be “drilled down” to also show the actual Ship Date of the order and an Item Description below.  (see red ellipses)

Figure 9 Gross Margin % drilled into to show Order Ship Date and Item Description

Summary

We have looked at some of the different ways that data captured in the ERP system can be presented and viewed by a user to better enable a user to understand the data and assess what action the user might need to take based on what the data is revealing about the business.  

We have picked some fairly straightforward ways in which the data needs to be presented to enable effective decision making.  In reality, we have only scratched the surface.  The intent of this article is to illustrate that effective data presentation is ultimately driven by what the business user needs to see in order to effectively perform their role. 

ERP systems are great transactional systems and can be very valuable in managing the day to day transactions in an organization.  But it is somewhat pointless for an organization to just capture the data in the ERP and leave it at that.  The real value from the ERP System is when organizations start to understand what is occurring in the day to day operations of the business and make effective decisions at every level in the organization based on that data.

Having a Business Intelligence System that enables these types of data views and data manipulation is exactly what we do at IntelliDash.  Come talk to us to learn more.

Schedule a Demo to look at the numerous Manufacturing KPIs that IntelliDash offers from your Infor CSI/SyteLine data (On-prem & Cloud alike)

This site tracks visits anonymously. Click the link to know more about our Privacy Policy.