Product Code and Item Cost Analysis
One of the most important activities of the Purchasing function is to understand the cost of what they are paying for items over time. This is especially true now as inflation or tariffs can have a significant impact on an item’s costs versus prior years. Using a pre-built dashboard named Item Cost Savings enables a Purchasing organization to get a visual look at items that may have changed significantly in cost over the past year. In Figure 1 below we see the Item Cost Savings dashboard organized by Product Code and Planner Code comparing the years 2020 and 2021.
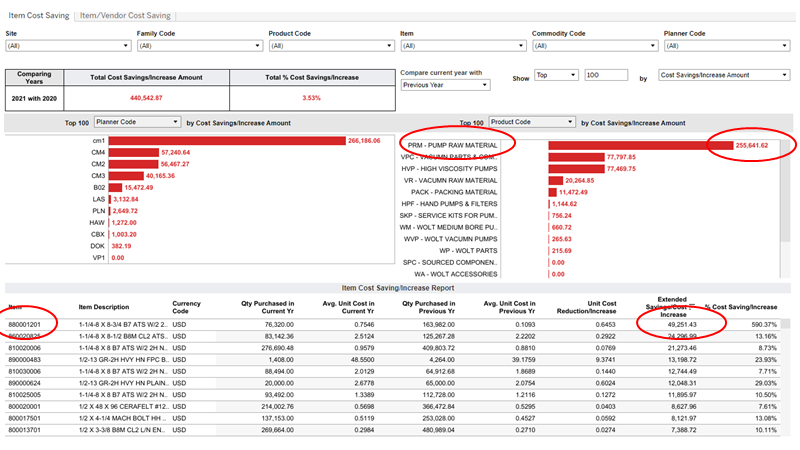
The Product Code PRM (Pump Raw Material) shows a significant increase from 2020 to 2021. (See two upper red ellipses) (NOTE: The red bar indicates a cost increase year over year. A green bar would indicate a year over year decrease) This cost increase of over $255,000 is more than 3x the next two highest Product Code cost increases and worth looking at further. Below the graphical view is a tabular view of the specific Items and their associated costs. The tabular view has been sorted by the overall Extended Savings / Cost Increase. In this example we see that Item 880001201 is the largest contributor to this cost increase with a year over year increase of more than $49,000. (see two lower red ellipses). With this information we can now explore this Item in more detail.
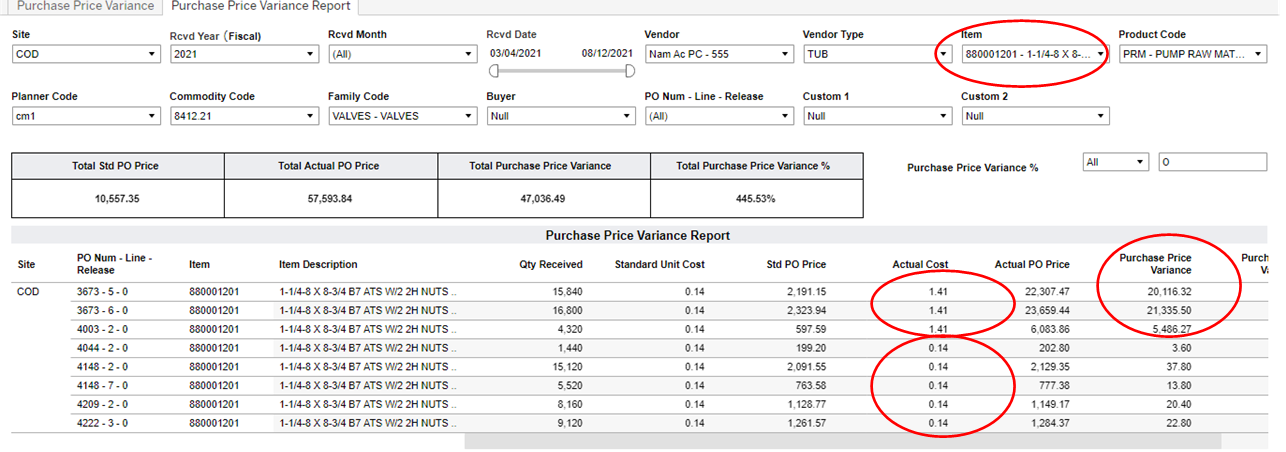
Figure 2. Purchase Price Variance Report
In Figure 2. Above we are now looking at a Purchase Price Variance Report filtered for just Item 880001201. (See upper red ellipse). Below in the table we can see the various purchases of this Item in the recent several months. In this data we see the most recent three purchases of this Item (NOTE: data sorted by PO number) are significantly higher and represent a significant Purchase Price Variance from other purchases of this Item (See middle two ellipses). The prior purchases of this Item were at a Unit Cost of $0.14 and the more recent purchases have been at a Unit Cost of $1.41. Representing a 10x increase cost. With this information the Purchasing organization can now determine why such a major increase in these items. Was it due to a supplier change? A rush order? a supplier price increase, etc.. Using these pre-built dashboards the Purchasing organization can determine precisely the Item and actual PO against which these price increases occurred and how to respond appropriately.
Additionally an organization may want to understand its overall relationship to a specific Vendor. The dashboard illustrated below in Figure 3. Item/Vendor Cost Saving can help an organization see what it is spending with a particular Vendor and how that spend has been changing year or year.
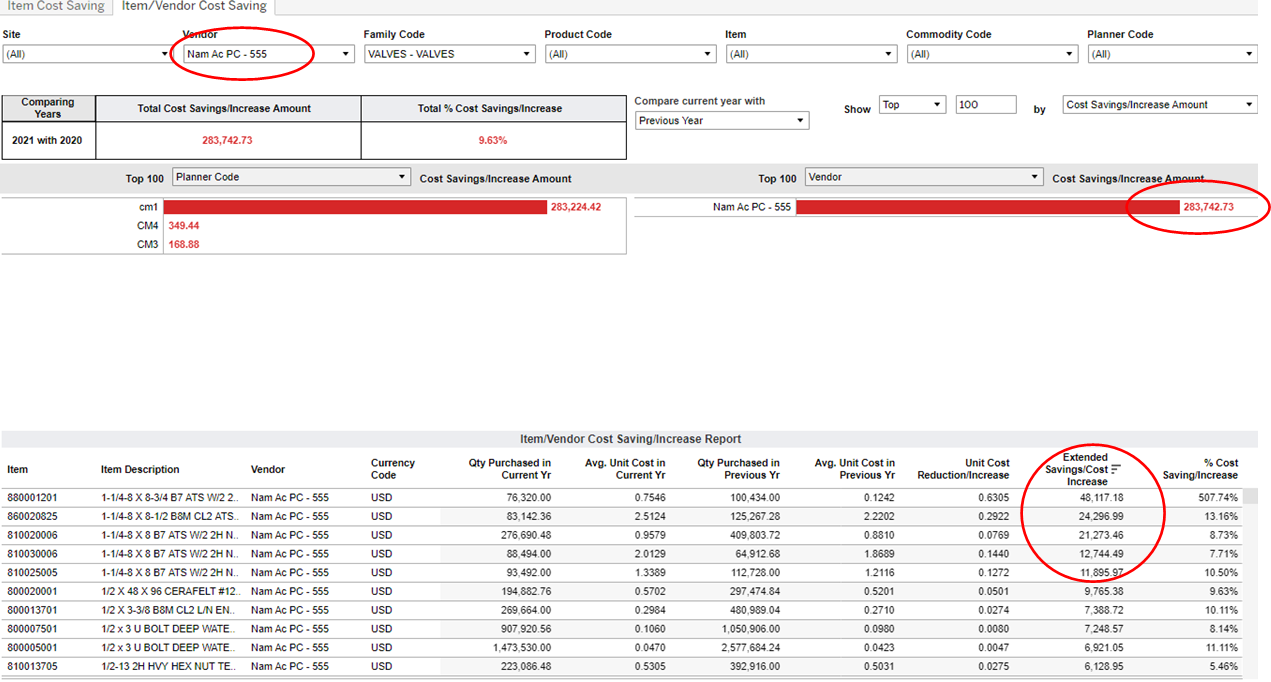
Figure 3. Item / Vendor Cost Saving
In the above dashboard we can see the overall Item/Vendor Cost Saving or Increase. For the Vendor Nam Ac PC -555 (see upper left red ellipse). This is the Vendor that is supplying the Item 880001201 that we had looked at above. In the above chart we can see that the organization’s costs have increased with the Vendor by over $283,000 from year to year. (see upper right red ellipse). Looking at this data in more detail below in Figure 4. Item Vendor Cost Saving Filtered by Vendor we can see that the Item 880001201 cost has increased by over $48,000 year over year. In addition, several other Items that we acquire from this same Vendor have also increased significantly in cost year over year (see right red ellipse). The dashboard above allows the sorting of data in the above present table. The column second from right titled Extended Cost Savings / Cost Increase has been sorted from high to low to show those Items whose cost has increased the most year over year (again see lower right red circle). This same data is displayed below in Figure 4. in a bar graph format (see right red ellipse).
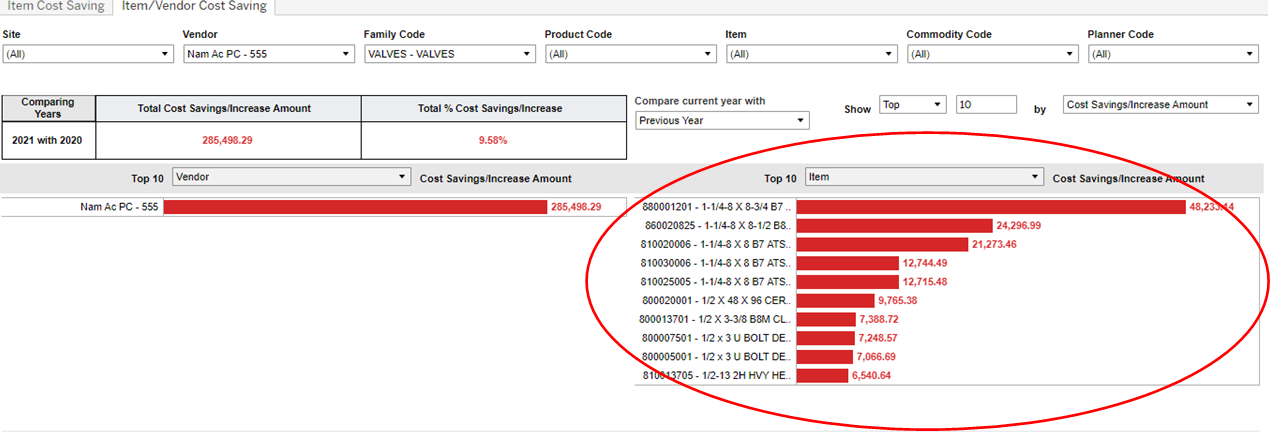
Figure 4. Item / Vendor Cost Saving Filtered By Vendor
One of the extended capabilities of our dashboarding technology is that this data can also be downloaded in other commonly used formats. Below in Figure 5. the data from Figure 3. above has been downloaded into an Excel format. In this format.we can sort and analyze the data in some more detail.
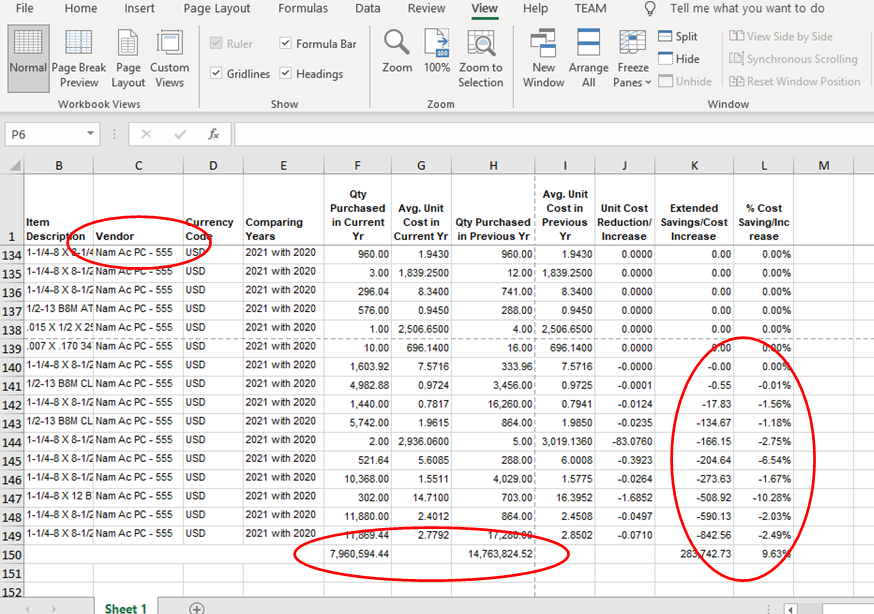
Figure 5. Item / Vendor Cost Saving / Cost Increase in Excel
In Figure 5. Item / Vendor Cost Saving / Cost Increase in Excel we can see the data from Figure 3.into Excel. This data has again been sorted by the column titled Extended Savings / Cost Increase. We can see the Vendor is Nam Ac PC 555 (see upper left red ellipse). Looking down below we can see what overall spend has been for this Vendor in the current year and prior year (see lower middle red ellipse). While this number has decreased, the current year is only partially over, so the overall spending may end up being quite similar year over year. In addition these numbers indicate that the organization is spending a significant amount with this Vendor, in the example in Figure 5. It is more than $7 million in the current year to date. Looking at the two right columns titled Extended Cost Savings and % Cost Saving / Increase (see lower right ellipse) we can see that the Vendor hasn’t increased the price on everything we buy from them as some Items have decreased in cost year over year.
Vendor by Item Analysis
With the information from the above analysis we can delve deeper into understanding our costs from a specific Vendor or set of Vendors. This may perhaps reveal possible cost savings by leveraging different Vendors for the same Item. Below in Figure 6. We have a comparison of the Item 880001201 and the different Vendors that we acquire the Item 880001201 from. Figure 6. Below is output from a dashboard we provide called Purchasing Matrix. This dashboard enables a user to select different criteria for rows and columns and thus provide a very robust capability for analyzing the different parameters or attributes that might be relevant to size up Purchasing cost savings. In Figure 6. below we can see that we are looking at only Item 880001201 (see upper right red ellipse). This information has then been narrowed to show only the Item Quantity for the row and Vendor for the column (see two right red ellipses). The matrix data is then displayed below to the lower left of the dashboard. From this we can see that we have been acquiring this part from three different Vendors over the past several years. The Vendors are Donec, Nam, and Nunc (see lower left red ellipse). This gives the Purchasing organization immediate insights that there may be savings possible for this particular Item among these three different Vendors.
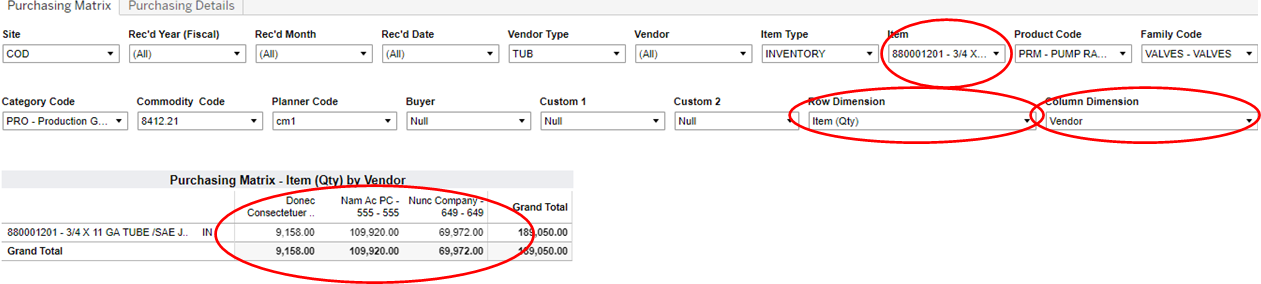
Figure 6. Purchasing Matrix Item and Multiple Vendor Comparison
Pursuing this analysis further we can leverage a Purchasing Details dashboard that is shown below in Figure 7. Figure 7 is a dashboard showing all the purchases of the Item 880001201 over the past 3 years, in this example this is the only period for which we have data in the database (see upper right red ellipse). This data shows that the organization has made 16 line item purchases of this Item in the past several years (see middle red ellipse). The dashboard has a table below that shows detail for the 16 different purchases. From this we can see the top two lines show purchases from Nunc and Donec (see lower left red ellipse). Looking at these purchases in detail we can see a purchase price of $0.07 from the Nunc company and $0.16 from Donec (see middle right ellipse). These two values are significantly less on a unit cost basis than the recent purchases from Nam Ac PC of $1.41 on a unit cost basis (see lower right ellipse). The Purchasing organization with this information could now pursue an alternative sourcing strategy to enable cost reductions for this Item by requesting bids from all three of these Vendors at reduced costs.
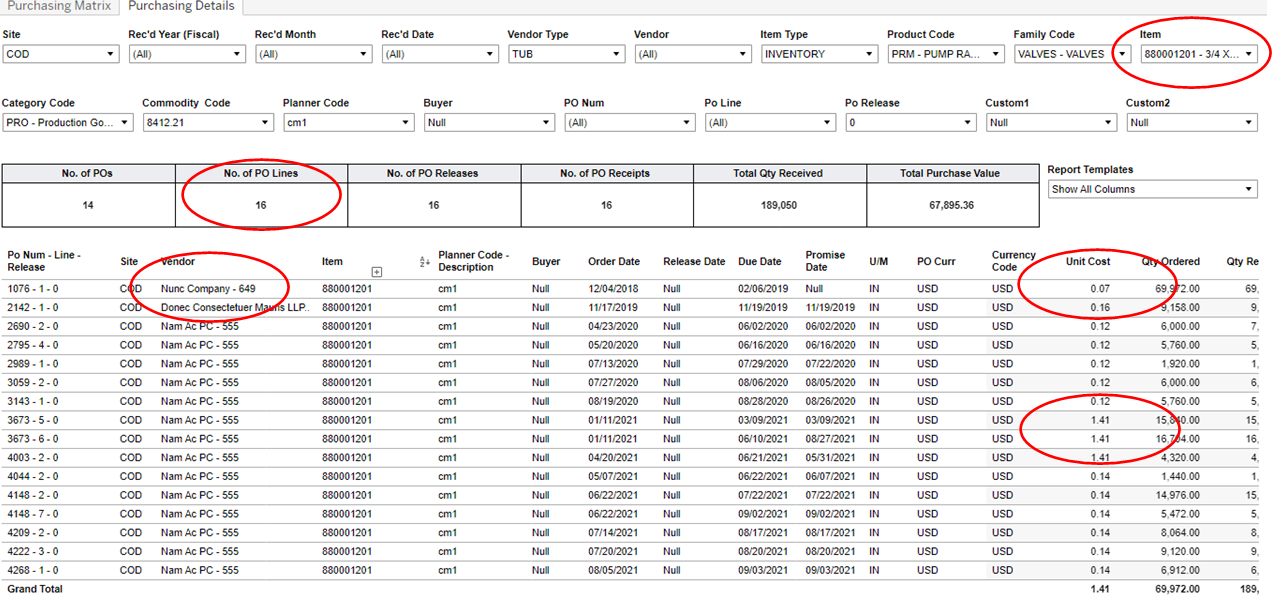
Figure 7. Purchasing Detail Item History