Overview
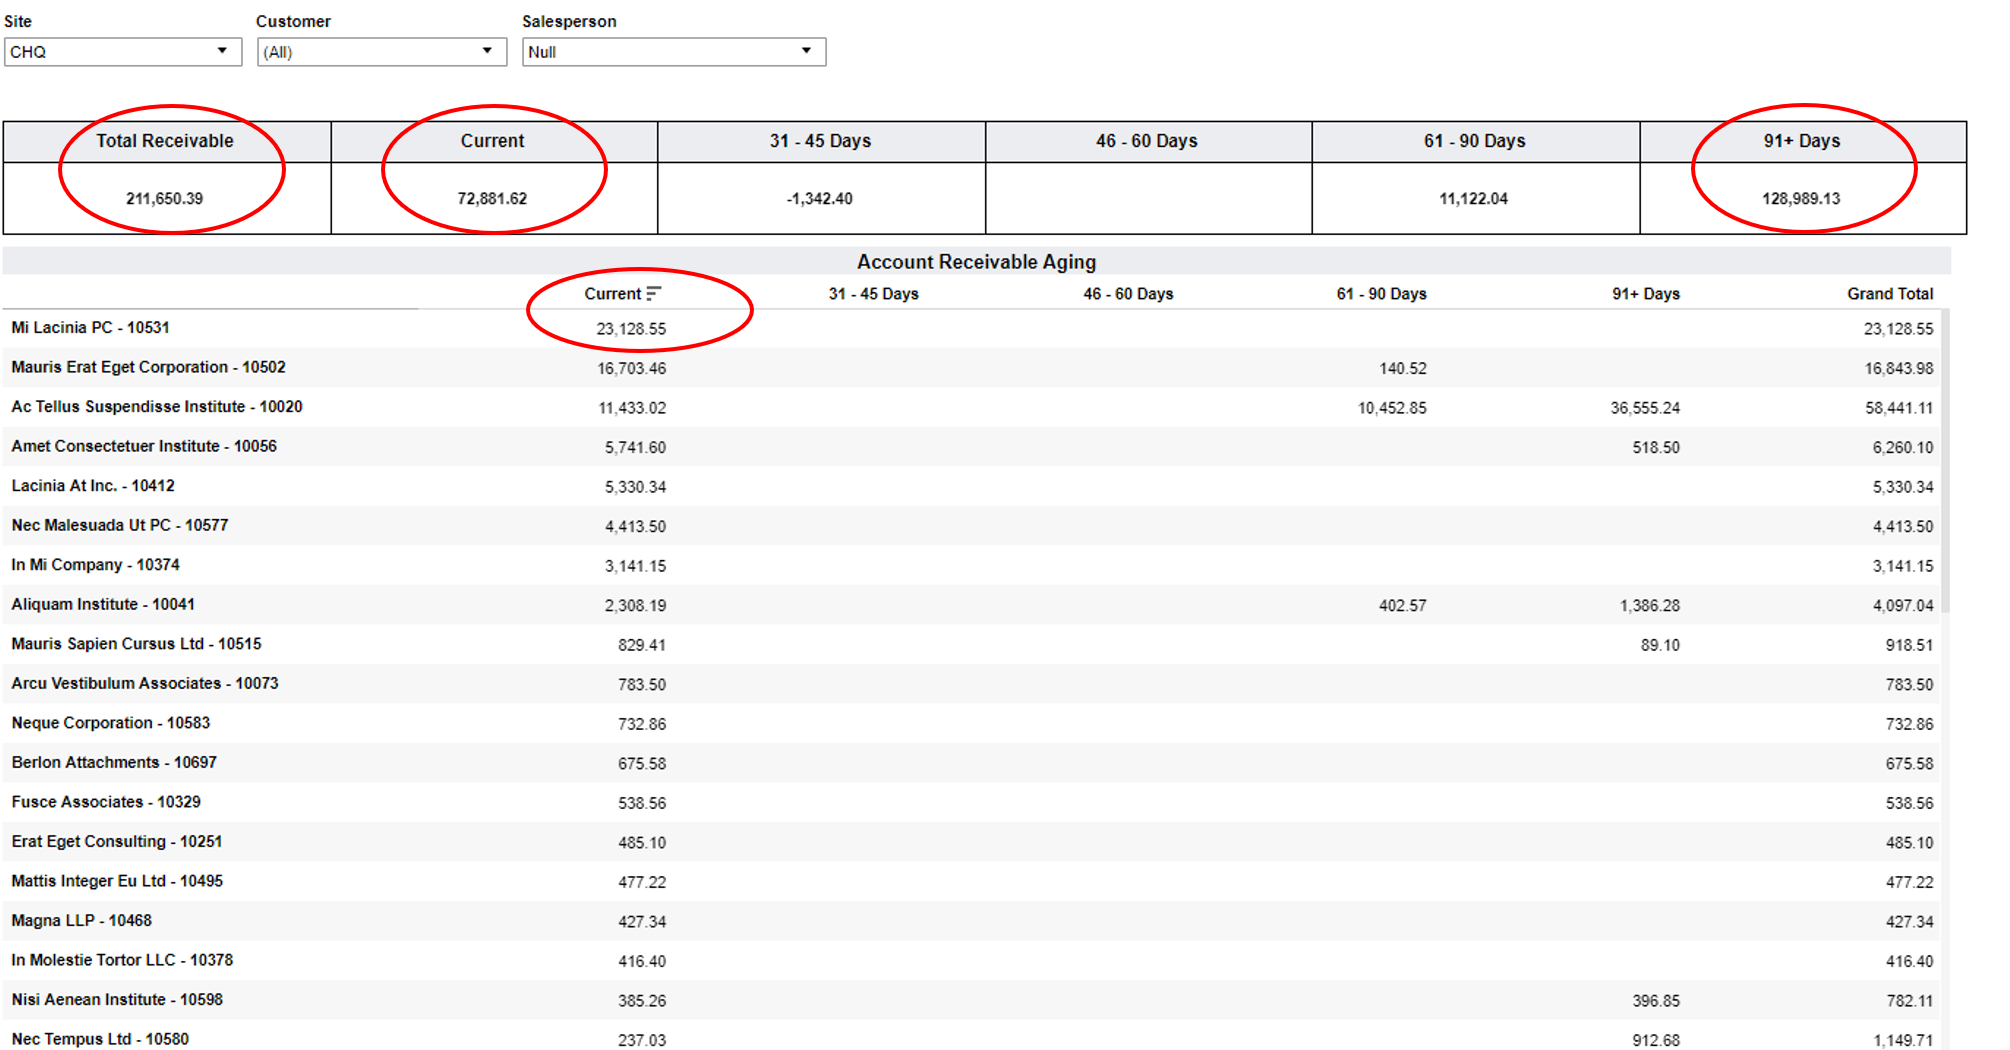
One of the first areas to examine is what is the overall state of the Accounts Receivables. Typically this involves looking at something called an Accounts Receivables Aging Report. In Figure 1 below is an example of such a report. Note that it shows across the top the summary of the data for the total Accounts Receivables and a breakout by different time frames. The Total Receivables and those that are considered Current (i.e. due in 30 days or less) are listed first (see two upper left red ellipses). Then the next time frames are broken out into different time buckets of 15 or 30 day time increments. The final tally is broken out in 91 days and greater. (see upper right red ellipse). The timeframe of 91 days is significant as this represents receivables due from a prior quarter. With many businesses reporting financial results quarterly, this is a red flag that the receivables may be difficult to collect and that they are impacting the reported financial results in a real way. Additionally below the summary data, the Accounts Receivables are listed by each Customer that owes these receivables in a tabular format. This data is also broken out in similar time frames. The tabular format is also sortable from high to low (or vice versa) according to these different time frames. In Figure 1 below the tabular data has been sorted by the first column (Current Accounts Receivables due in 30 days or less). This shows the various companies and what they owe in Current Accounts Receivables from high to low. (see lower red ellipse). NOTE: That the tabular data below is sortable by any of the columns shown.
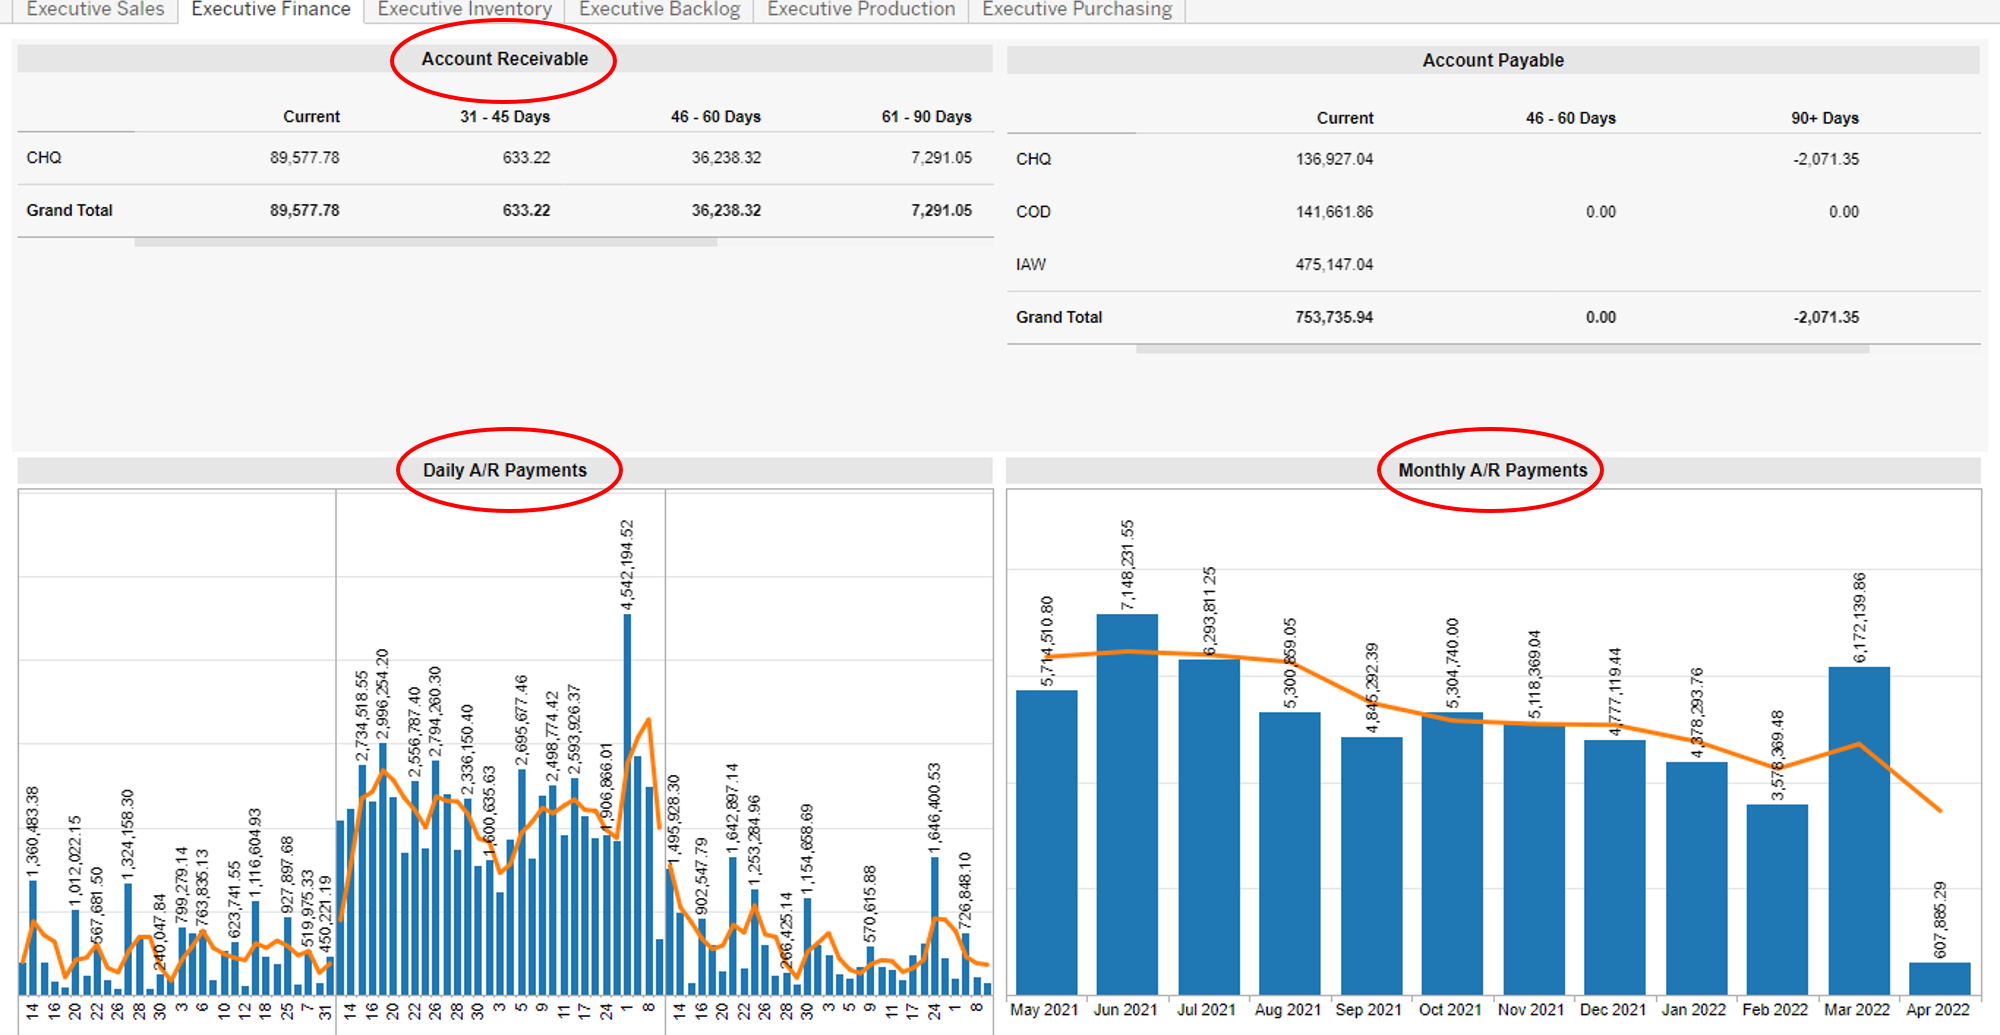
Another perspective that might be appropriate is to look at an Executive report that provides data on Accounts Receivables and how those payments are being received over time. In Figure 2 below we have an Executive Finance report that shows aggregated data for Accounts Receivables and Accounts Payables. At the top is shown the Accounts Receivables summarized over different time frames (see upper left red ellipse). Then below that the Accounts Receivables data is presented based on daily payments (see lower left red ellipse) and monthly payments (see lower right red ellipse). This data can help an Executive see how payments are trending over time, whether there are any patterns to the payments and whether there is any seasonality or other red flags in payment activity that should be noted.
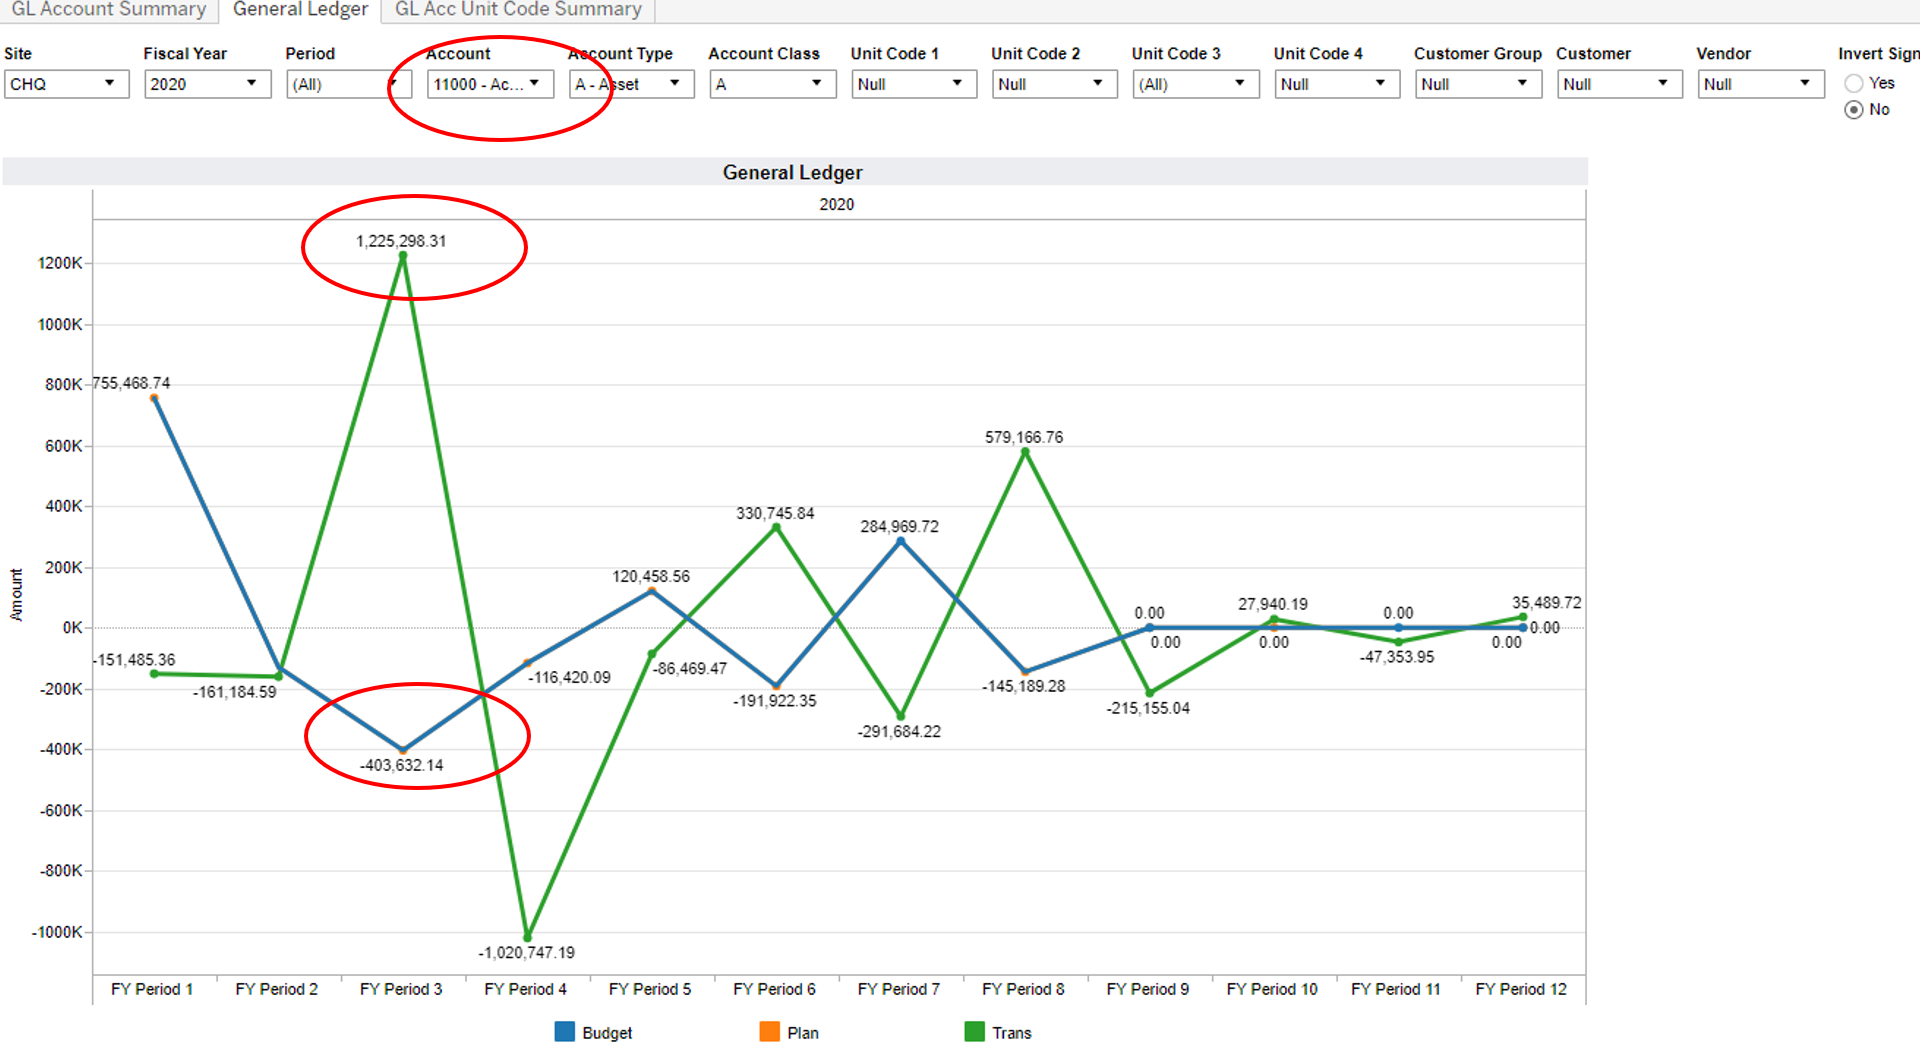
Another perspective of Accounts Receivables is to view it in comparison to what the company had planned for it to be (i.e. the budget). Below in Figure 3 is a view of the General Ledger budget data over time, filtered to just show Accounts Receivable (in this example Account 11000) (see upper red ellipse). The Blue line belows represents the Budget for Accounts Receivable and the Green line represents the actual Accounts Receivable transactions for a given period. This data has been broken out by Accounting Period which are essentially months. The dashboard below can provide insights as to whether revenue or expenses are adhering to the plans. In the example below there is a wide discrepancy in the Accounts Receivable actuals versus the Budget for the 3rd period (see two lower red ellipses). This may require further investigation by finance to understand why there is such a large discrepancy for that particular period.
Detail Look at Accounts Receivables
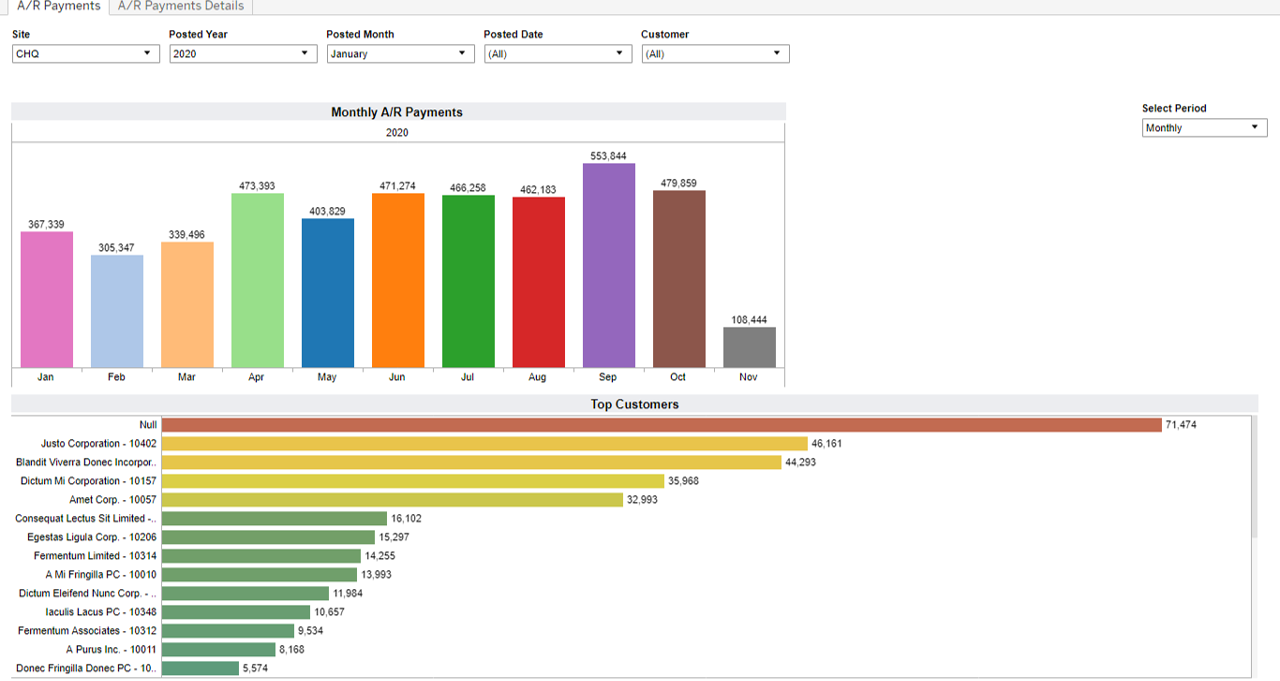
In a number of circumstances a Finance Executive may want to look into specific detail regarding the situation with Accounts Receivables. In these circumstances they may want to explore activity in Accounts Receivables for a specific month or in regards to a specific Customer. In Figure 4 below we have a report that shows the Accounts Receivable payments received for a specific month in this case the month January of 2020 (see upper two red ellipses). Below in chart form we can see the various Customers who had made Accounts Receivable Payments for this time frame (see lower red ellipse). If we are interested in the Payment activity for one of these specific Customers we select the bar next to the Customer name and click on it. This will enable us to drill down into the specific detail for that Customer for that month (in this example we are looking at the Customer Justo Corporation for the month of January 2020). This will then take us to the A/R Payments Details Report that is displayed below in Figure 5.
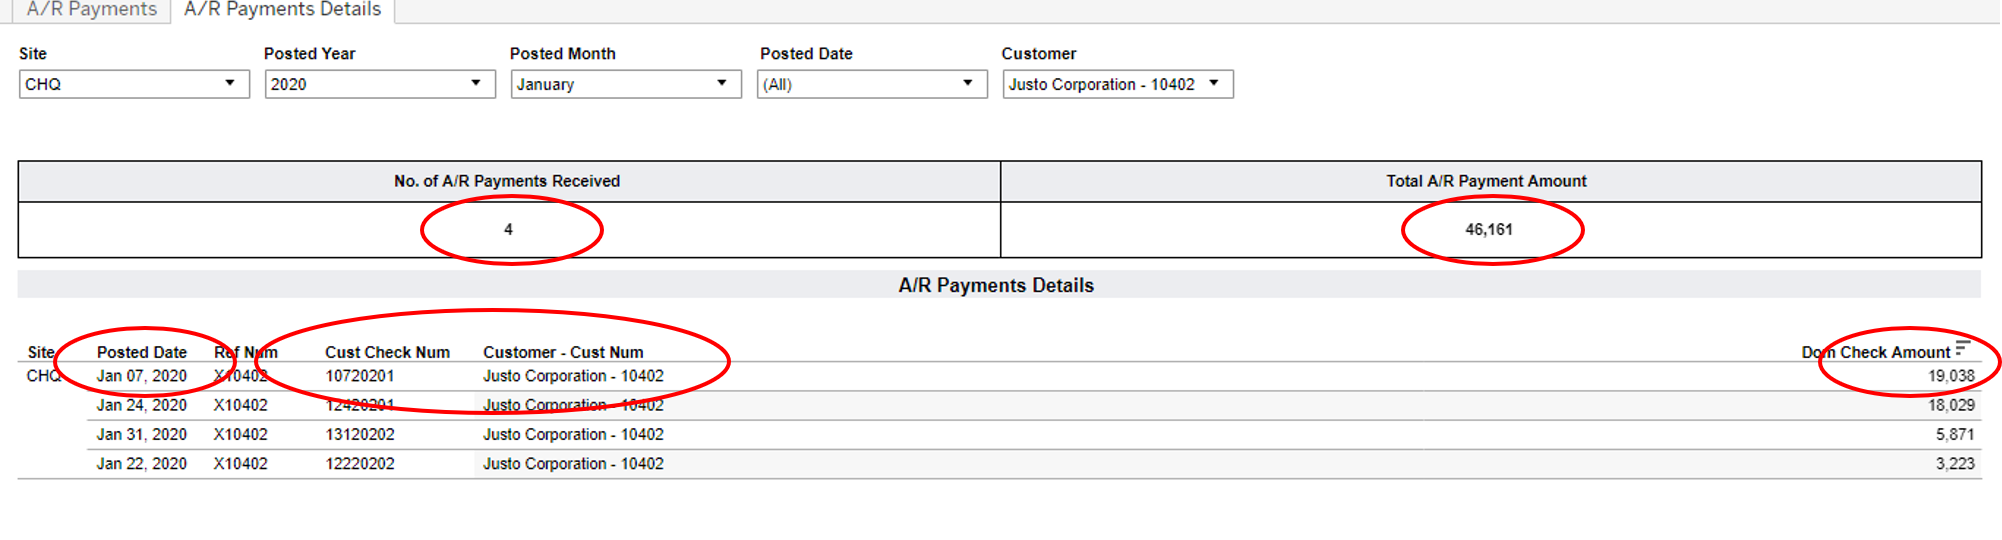
Below in Figure 5 we can see the details for the Customer Justo Corporation. In the month of January 2020 they made 4 payments totaling $46,161 (see two upper red ellipses). The specific Payment Date is illustrated (see leftmost red ellipse) and the actual Customer Check Number and the Customer Name are also displayed (see lower middle red ellipse). Finally the dollar amount of each specific Check is displayed in the far right column (see lower right red ellipse). This level of detail enables a Finance Executive to have very specific information about the Accounts Receivable history for a specific Customer and empowers them with the ability to know at a fine level of detail what is occurring with the Payment history of their Customers.
Accounts Receivables Customer Payments Views
For any organization it can be very important to understand how their actual Customers are making payments. As has been said, the “devil is in the details” and having a detailed look at how specific customers are paying, how timely their payments are, whether they are paying on-time or late can be valuable in better managing specific terms and conditions across the customer base.
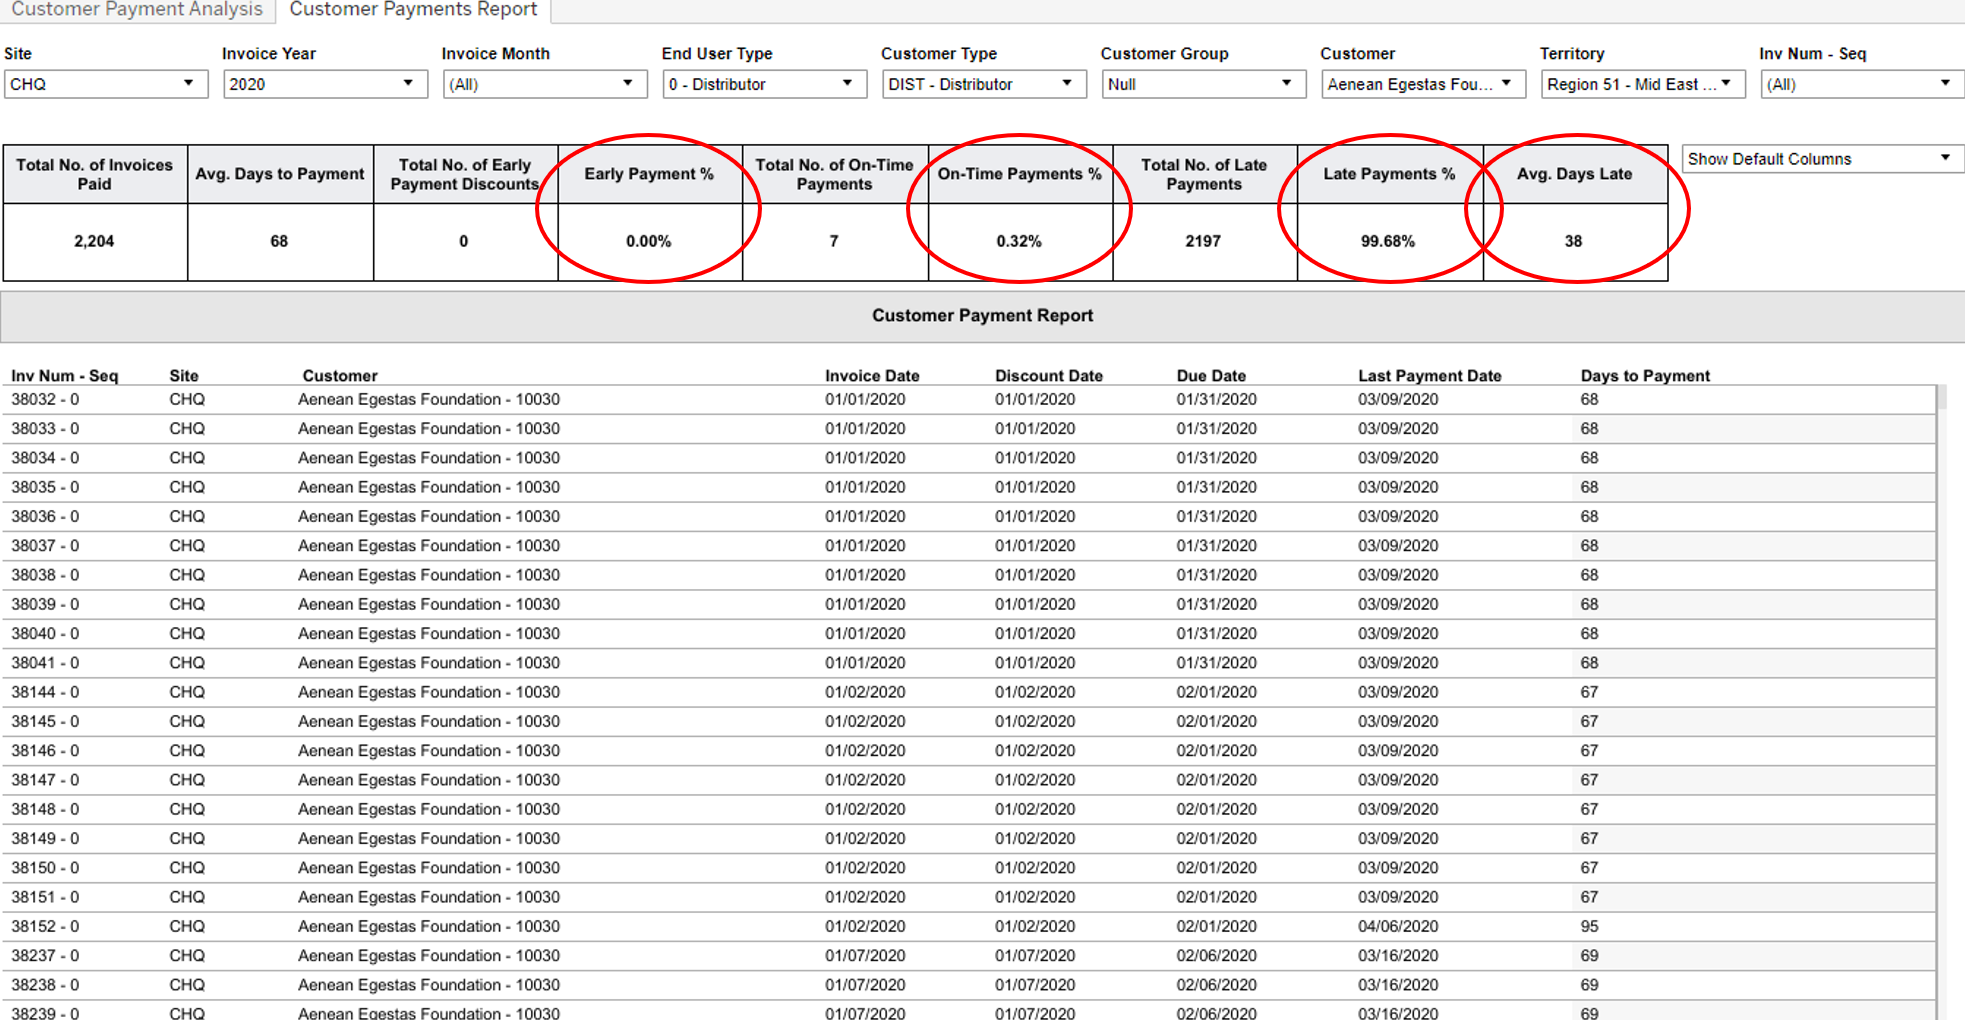
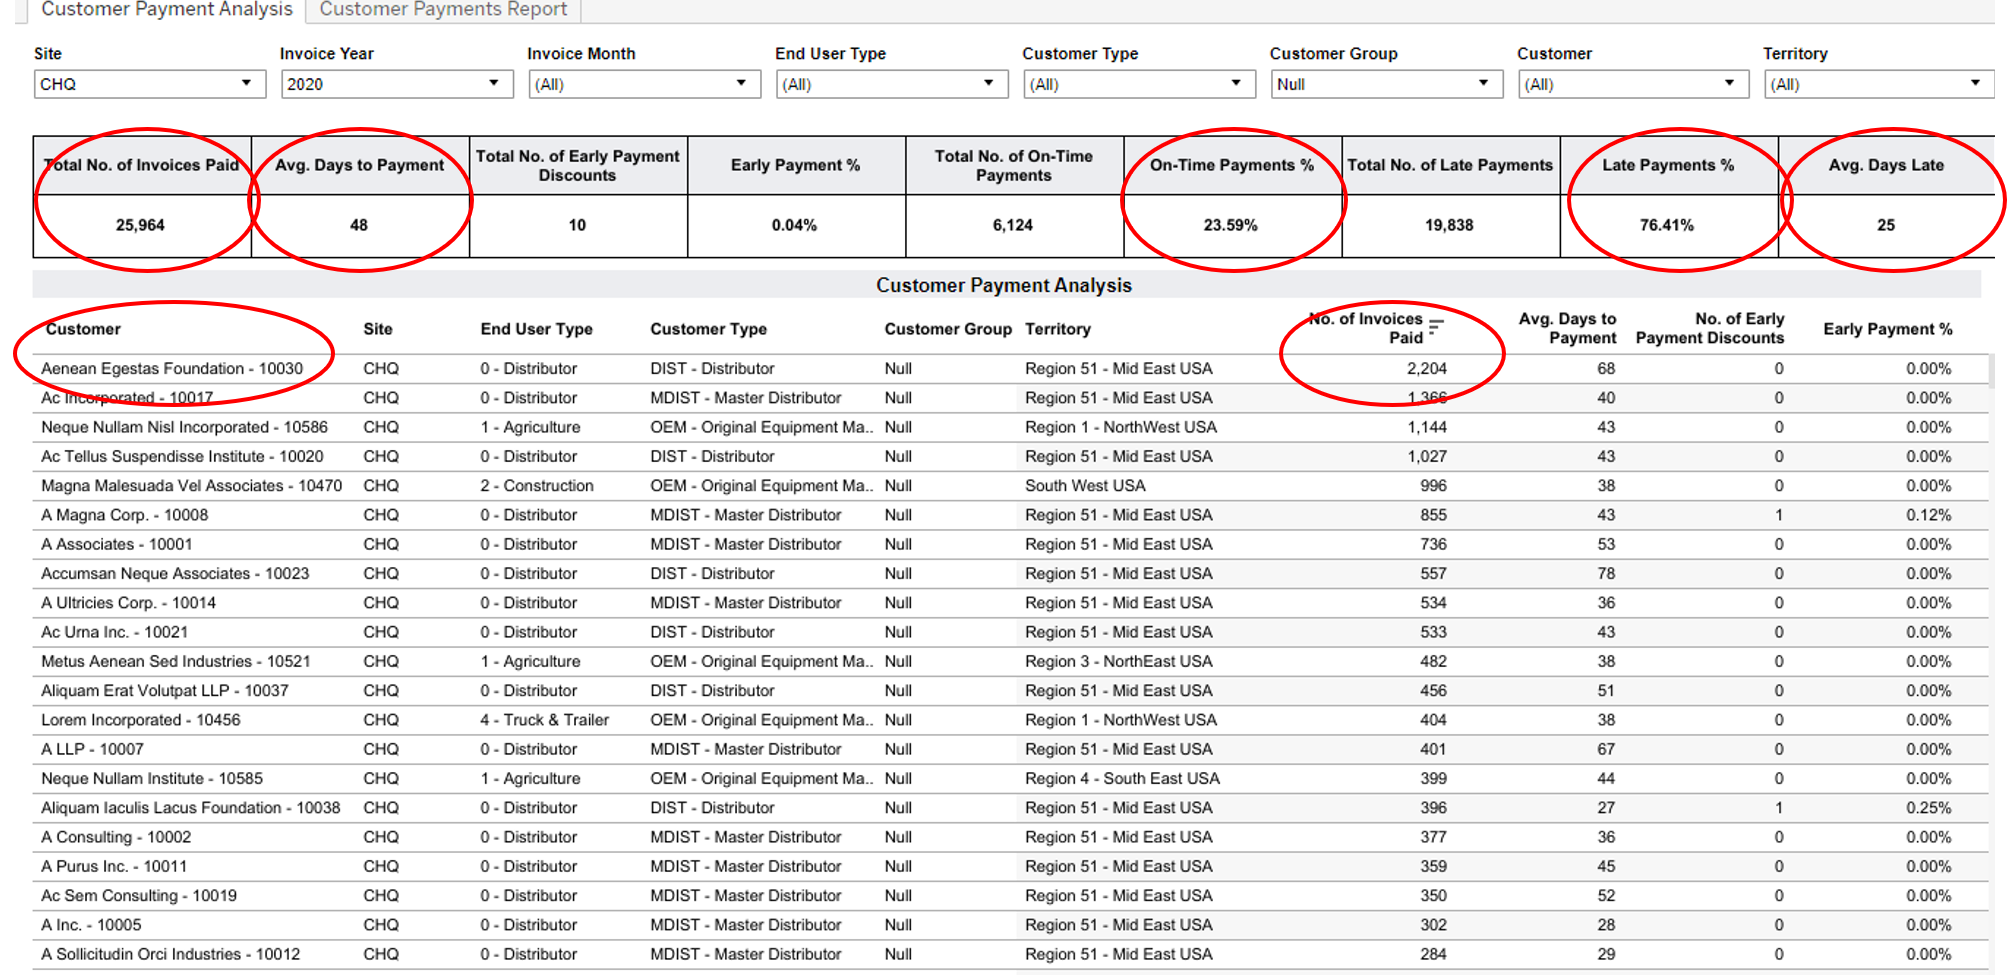
Using a dashboard called the Customer Payment Analysis we can look at some detail on how our Customers are paying us. Below in Figure 6 is an example of this dashboard. In the upper table we can see important data about Customer Accounts Receivable payment history. Across this table from left to right we can Total No. of Invoices Paid (NOTE: Data is for Fiscal Year 2020)., Avg. Days to Payment, On-Time Payment %, Late Payment %, and Avg. Days Late. (see upper 5 red ellipses). This data is a quick snapshot of how our Customers are paying their Invoices. Clearly at 76.4% Late Payments there are issues we will need to address. Below the summary data are specific details organized by the Customer. This data has then been sorted by Customer from the Most Invoices Paid to the least. (see lower right red ellipse). In this example the Customer Aenean Egestas Foundation has the highest number of Invoices Paid (see lower left red ellipse).
If we then filter this data using the filter setting under Customer to this particular Customer (Aenean Egestas Foundation) then select the Customer Payments Report tab, we get the view seen below in Figure 7. In this Report we can see the overall Payment data for this Customer and the specific detail in the table below. The table below has been sorted from high to low values of Days to Payment. Looking at the data in upper table we can see the Early Payment % (which is zero), the On-Time Payment % (less than 1%), the Late Payments % (over 99%), and the Avg Days Late (38 days) (see 4 upper red ellipses). With this data we have a clear view of what our Customers are paying, how timely those payments are, and which Customers have the most Invoices and how they are paying those Invoices. From this data we can make decisions as to what programs we may need to implement to ensure more timely payments, or perhaps directly connect with this Customer on the reasons for any Payment delays.