Financial Overview
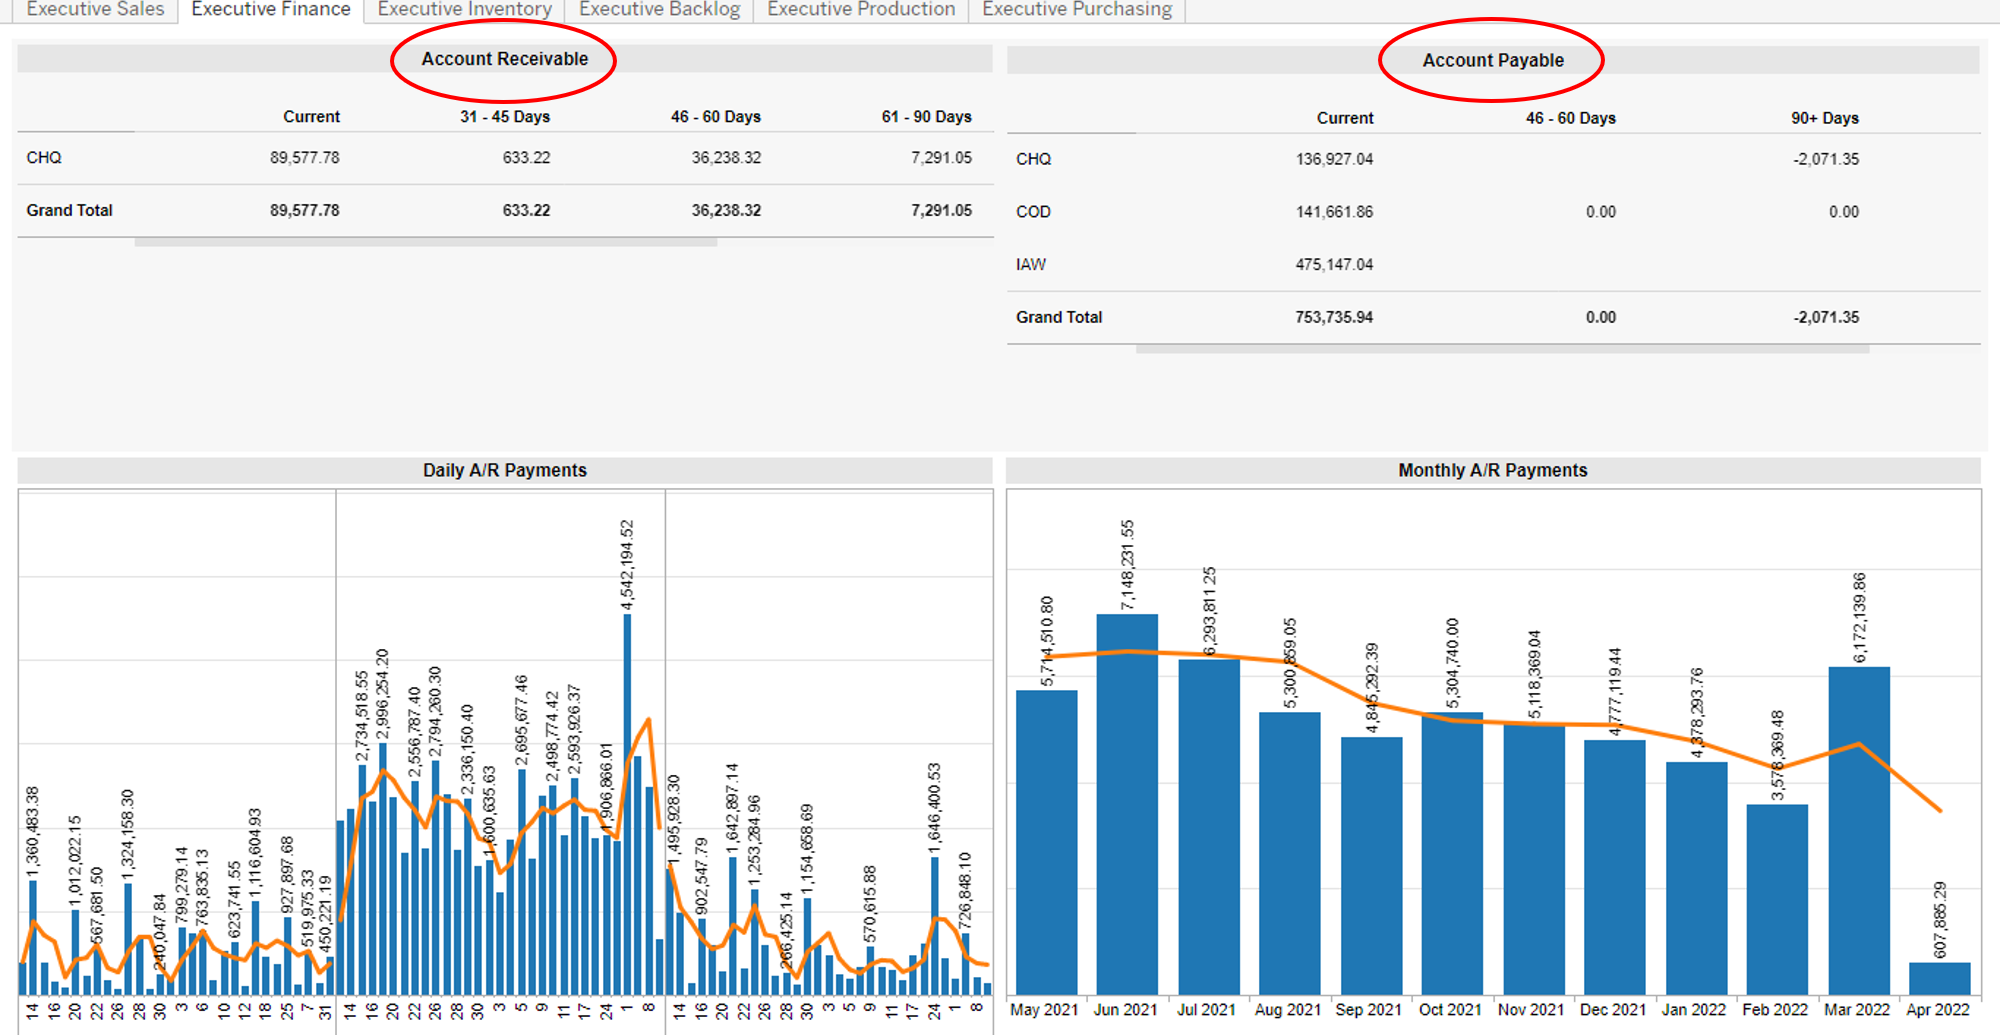
The first thing a Finance Executive will often want to look at is what is the overall state of the Finances from an Accounts Receivable and Accounts Payable perspective. Below in Figure 1 is an Executive Finance dashboard. This gives a Finance Executive a quick look at these two important areas of Accounts Receivable and Accounts Payable (see red ellipses below in Figure 1.) This quick high level look allows an Executive to see the timing of payments coming in (accounts receivable) and commitments (or accounts payable) that need to go out
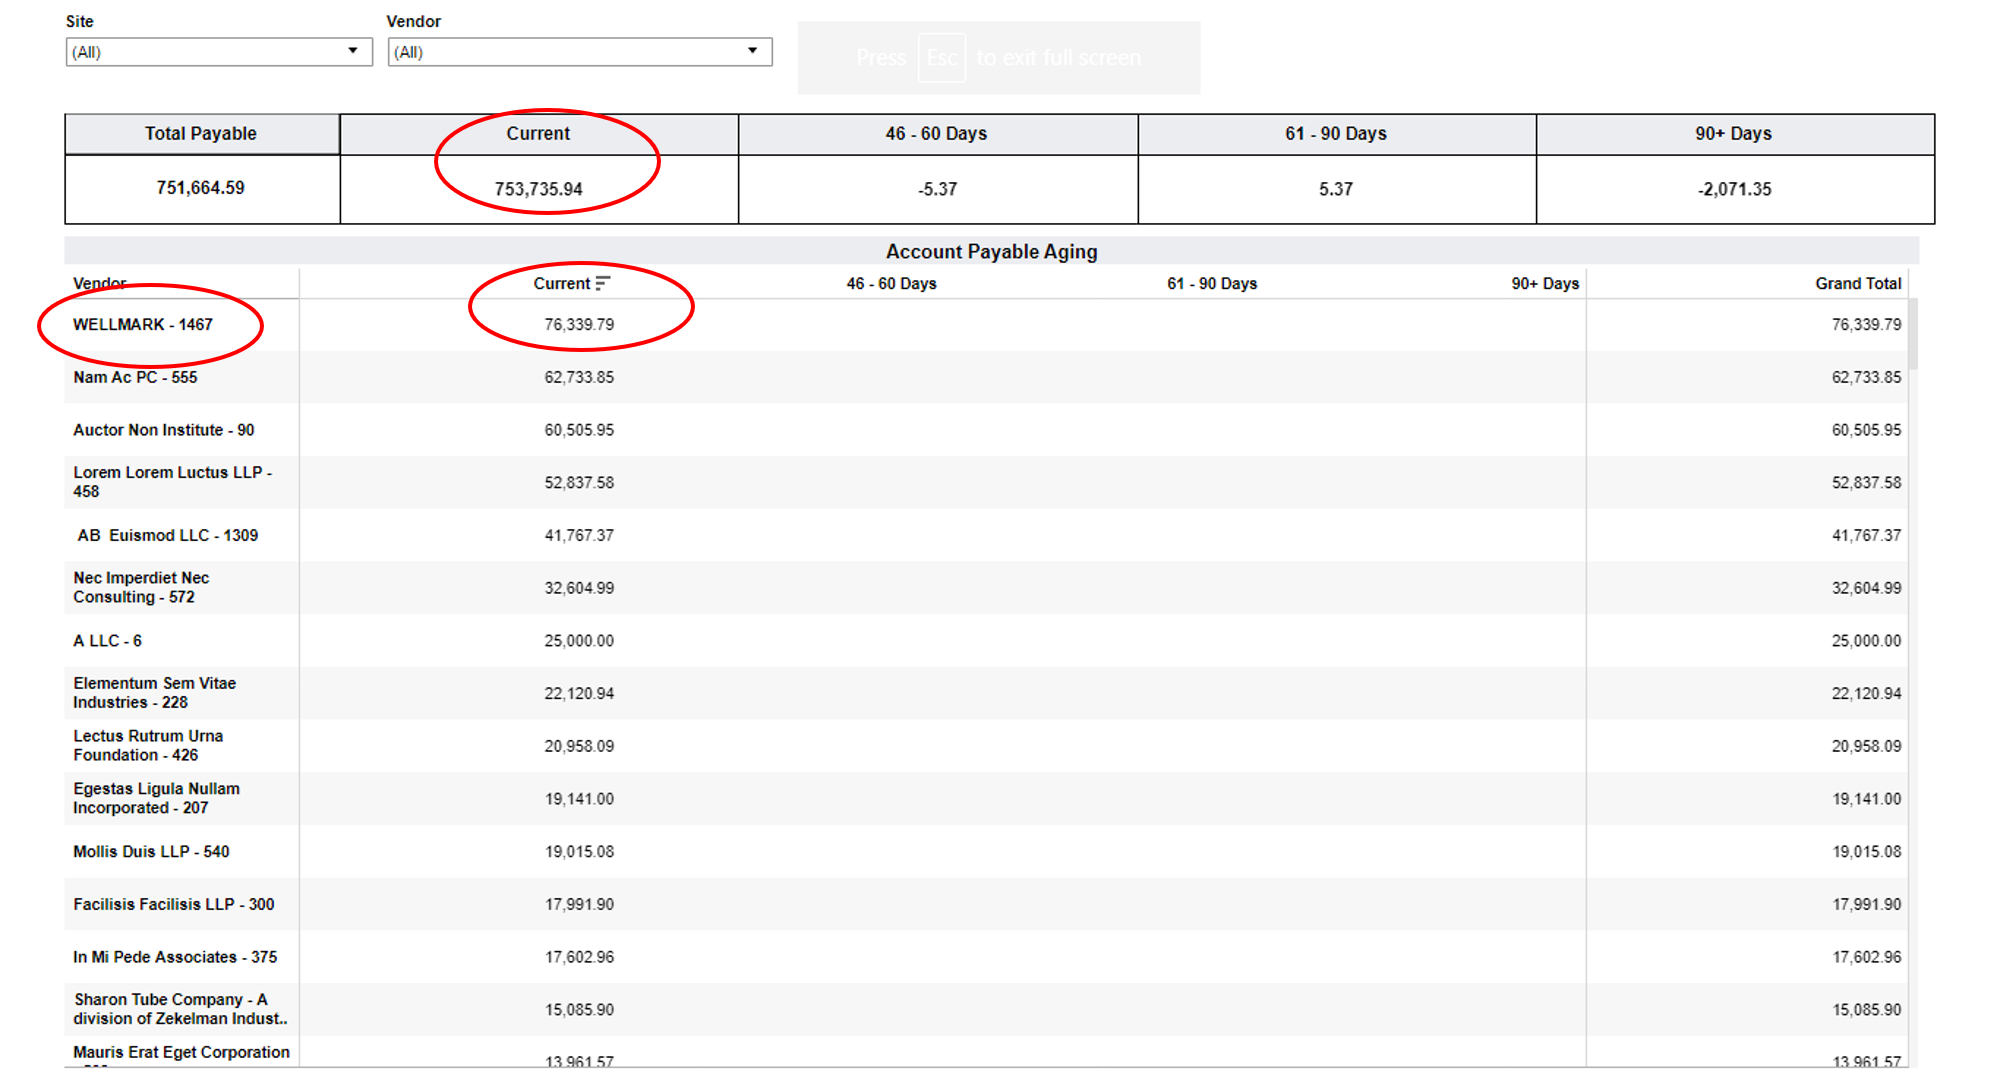
Accounts Payable Aging
Another key metric that an Finance executive may want to review is what is the status of the Account Payables? Are we in arrears anywhere? Or are we keeping up with the payments as they come in? One way to do this is look at an Accounts Payable Aging Report such as is illustrated below in Figure 2. This is a tabular type of report and as such could be downloaded into a spreadsheet and the data could then manipulated or analyzed as with any spreadsheet. In this case though there are some things that could be done with the data in the actual dashboard. Those include sorting by columns to understand what are the top Vendors to which an organization would owe payment. Below in Figure 2. Is an Accounts Payable Aging Report in the upper red ellipse we can see the Current Amount of Accounts Payables. (i.e. due in 0 to 45 days). There are nominal amounts owed in the 45 to 60 time period and 61 to 90 day time period. Actually these amounts are negative, which would indicate the organization has overpaid on some bills and is actually due money back. In the 90 day plus category we also see a negative number, which again indicates we perhaps overpaid on some accounts. As these are small amounts they may not warrant action, but if larger amounts were due then action would certainly be appropriate. Looking at the detail below, we have clicked on the Current column which sorts the column from highest to lowest amount (see red ellipse below right). Then in the left hand column we see the Vendor name (see red ellipse below left). In this example we see the company name Wellmark and that we owe them over $76,000. Comparing this to the total owed in the table above, this represents over 10% of our Current Accounts Payable owed to a single vendor. While there is nothing to be alarmed by in this Accounts Payable Aging Report, this capability to see what we owe and to whom we owe it to, is valuable in understanding our relationship to our Vendors..
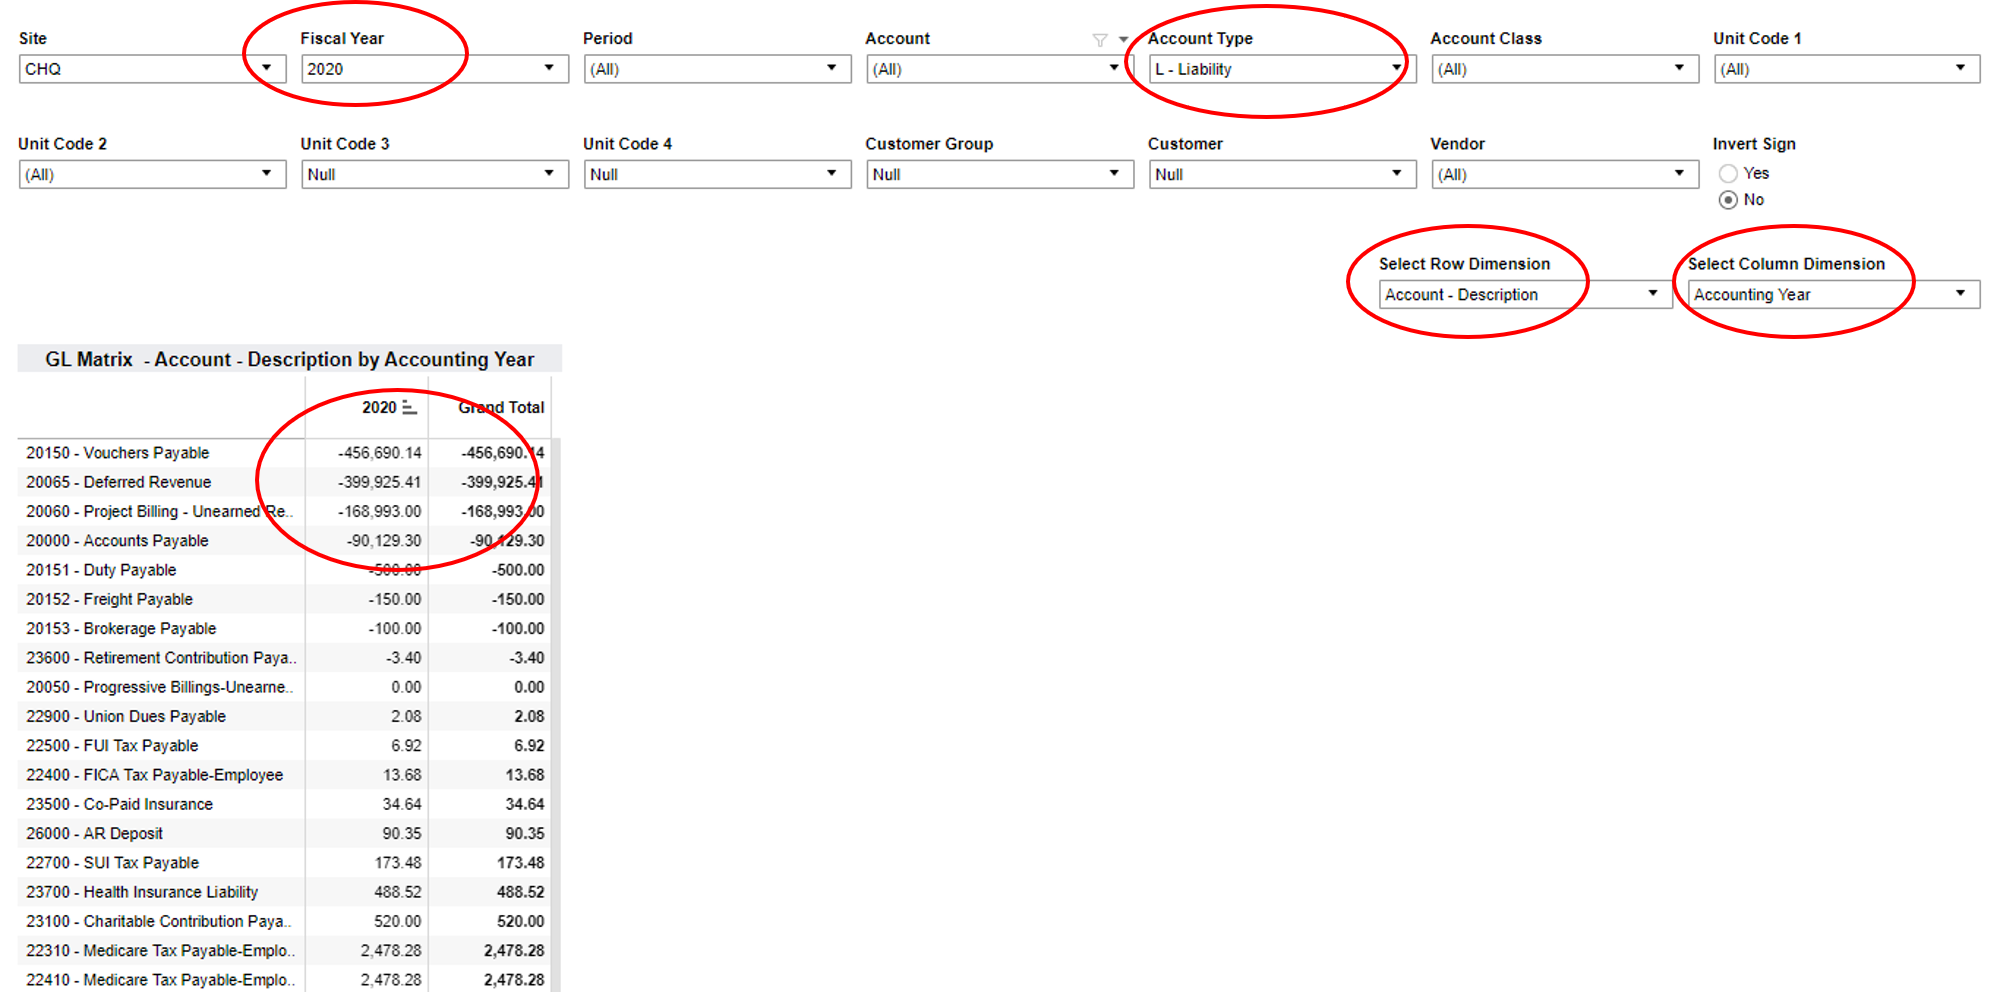
General Ledger Matrix by Account and Year
Another report that might be valuable to a Finance Executive is being able to see Accounts from the General Ledger for which the organization owes payments. In Figure 2 below we can see such a report. In the upper red ellipse we can see that we have selected only the Account Type marked L or Liability. Then in the two red ellipses to the right we have arranged the rows to represent the Account Description and the columns to represent the Year. In the red ellipse to the upper left we see that we have narrowed the year down to just one year in this case 2020. Finally we have sorted on the Year column so that the different Accounts for which the company owes payments are sorted from high to low values. In Figure 2 below we can see that we highest payment category is Vouchers Payable, followed by Deferred Revenue, then Unearned Project Revenue, followed by Accounts Payable. In this example we can see all of the relevant Liabilities the company has by Year and by Account.
General Ledger YTD Accounts Payable Comparison
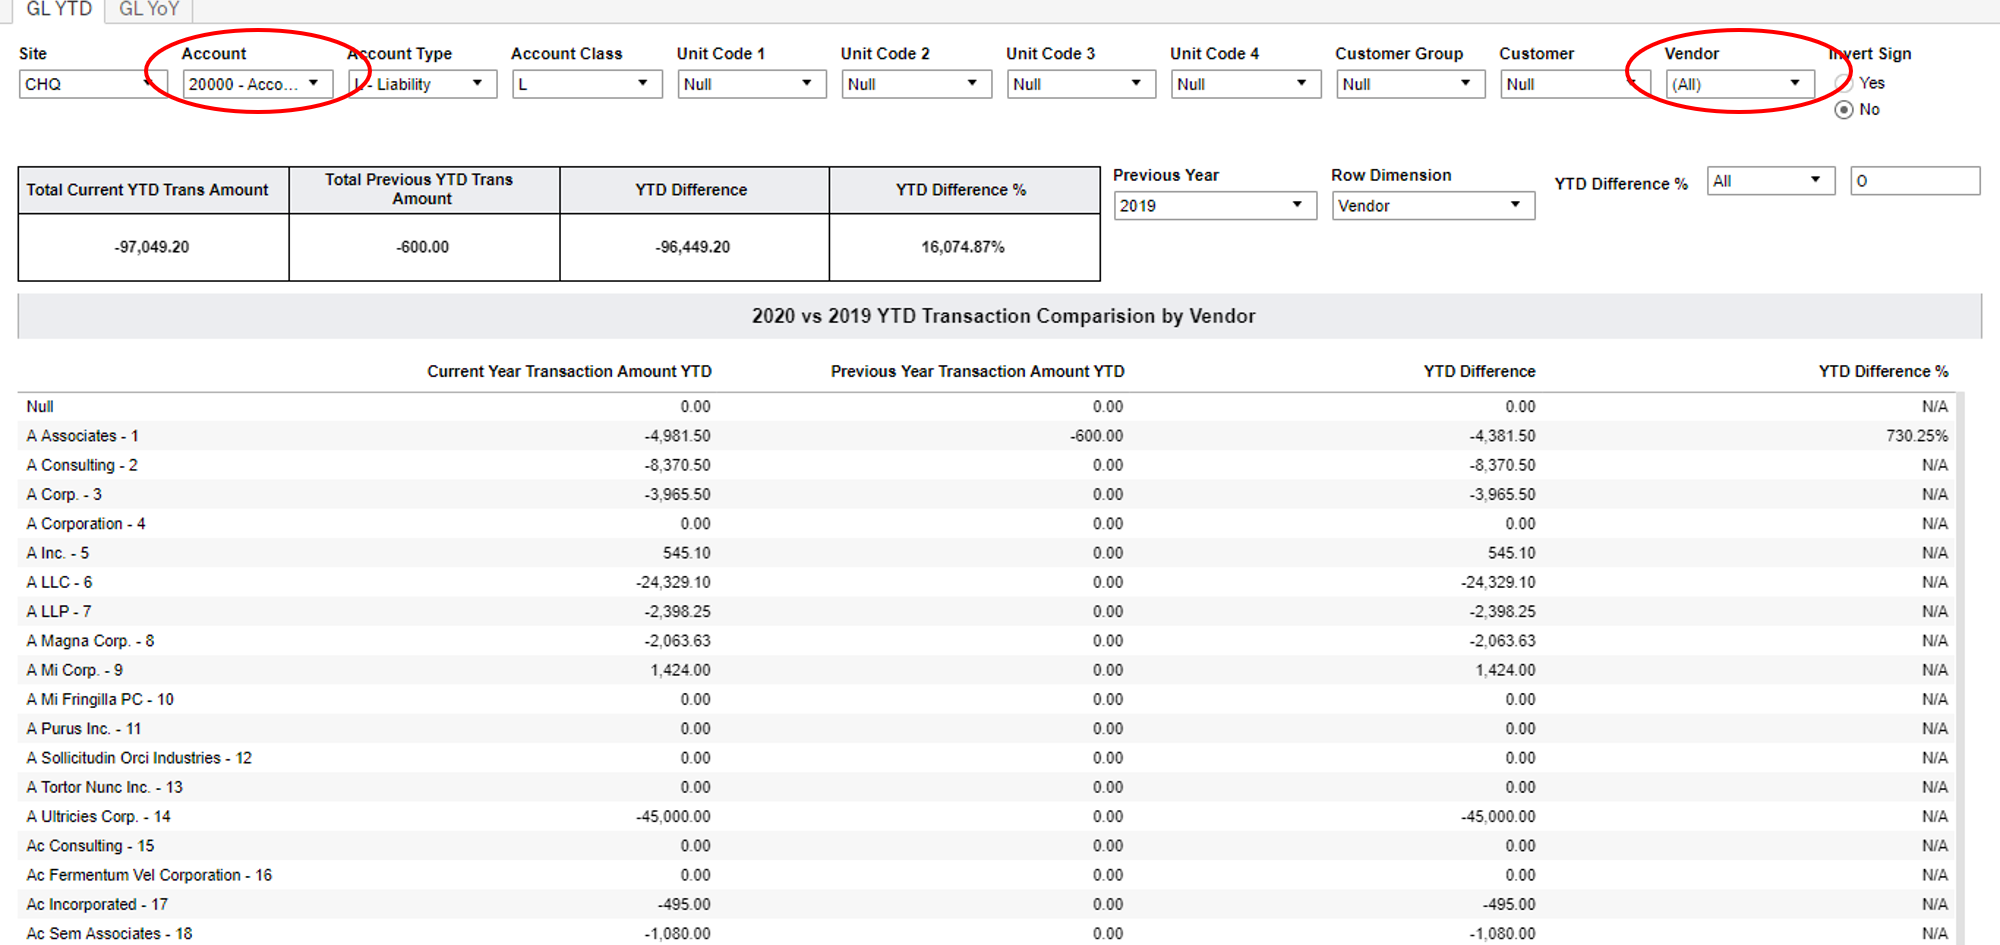
Another area of analysis a Finance Executive may want to examine is looking at what are their Accounts Payable Liabilities by Vendor from Year-Over-Year and what they may be Year-To-Date. In Figure 4 below we see a report show this data. In Figure 4 below we see just Accounts Payable data (see red ellipse to the upper left). Then we can see this data is arranged by Vendor (see red ellipse to the upper right). The data below is sorted alphabetically from A to Z. What is illustrated is only a small fraction of the Vendors, as to include any more would result in a very long list. What is important to note about this data is that it allows the Finance Executive see the spend with a given Vendor through the Year-To-Date perspective, but also to see a comparison of that spend from the prior year at the same point in the year. From this one can see which Vendors are seeing the most spending from the organization and how that may compare to the spending in a prior year. This view is sorted alphabetically, but could be sorted from high to low spend by either the current or the prior year’s spending.
General Ledger – Accounts Payable Trends
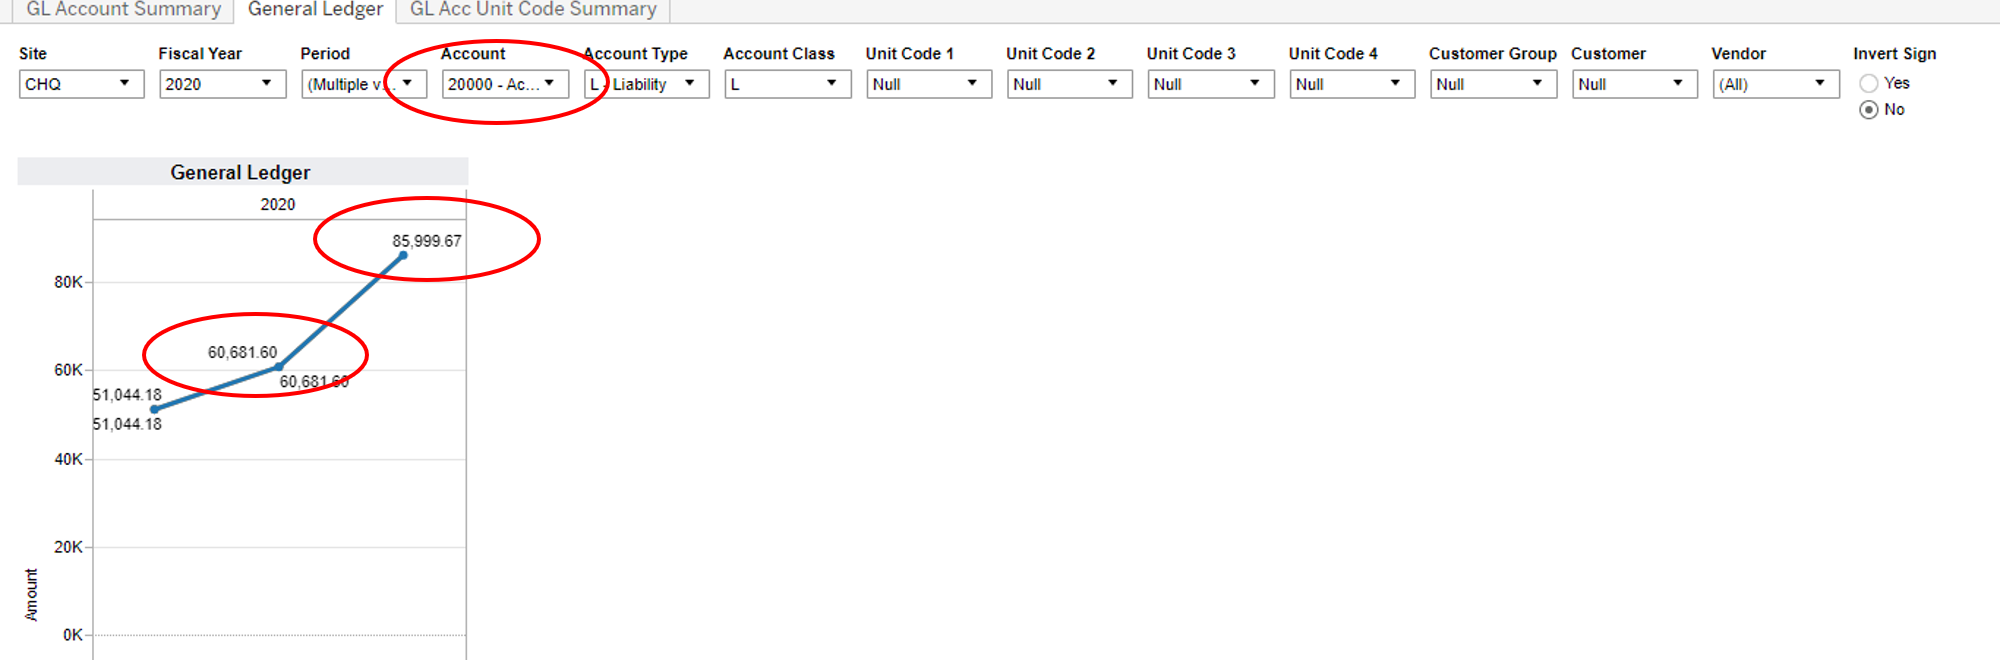
Next we will look at how a Finance Executive can look at the general trends in Accounts Payable over time. Below in Figure 5 we see data pulled from the General Ledger but only for the Accounts Payable GL account (see upper red ellipse below) which is for Account 2000 the Accounts Payable account in the General Ledger. Below this has been plotted for the first three months of the year 2020. We can see below that the trend line is up over the first three months of the year 2020. In month 2 the spend on Accounts Payable was $60,681 and in the 3rd month this went up to $86,000 (see two lower red ellipses below). Of course whether either of these numbers should be a concern is not apparent, but the dashboard below presents the data regarding the organization’s spending for Accounts Payable in an easy to see and understand graphical format.
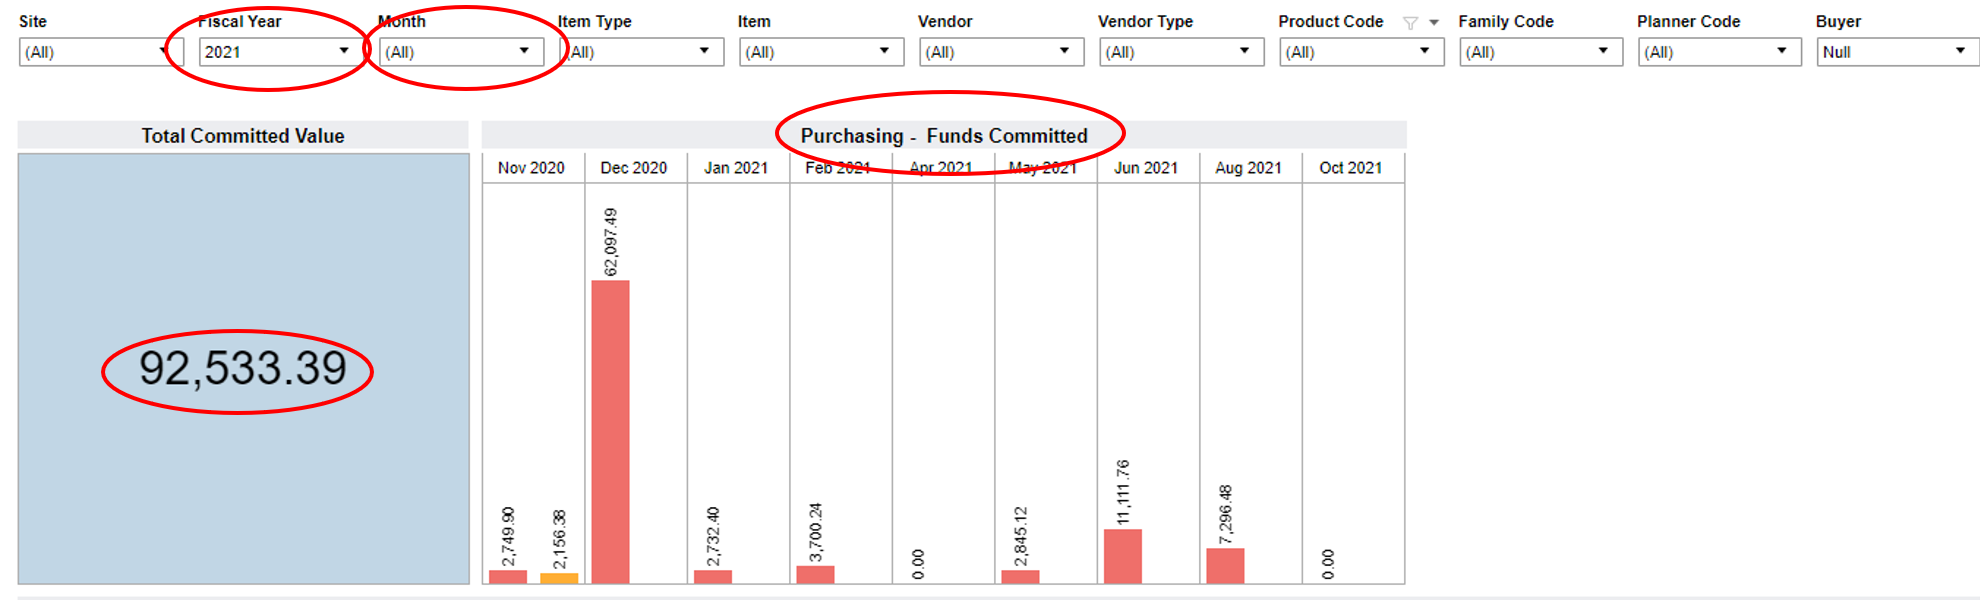
Purchasing Funds Commitment
One important metric a Finance Executive may want to examine are what financial commitments has the organization already made and what do those look like over the near future. In a manufacturing organization the commitment of future funds is often related to raw materials and components needed for the manufacturing process. Many of these items are acquired via the Purchasing Process using a Purchase Order. The commitments that have been made through these Purchase Orders can be tracked and understood especially as a Finance Executive may want to understand these over the next several months or quarters. In Figure 6 below we can see this commitment displayed via a dashboard called Purchasing Funds Committed. In this dashboard the time period is a Fiscal Year that begins in November (see red ellipse upper left). We are then looking at all the amounts that have been committed on all outstanding Purchase Orders for the next 12 months (see red ellipse upper right). These commitments are then broken down by month in the bar graph below (see red ellipse lower right). Lastly the total amount committed over this year is displayed as $92,533 (see red ellipse lower left). This particular snapshot provides insight not only into what the outstanding Purchase Orders are, and thus the Account Payables commitments for these periods, but also how that is likely to play out over time. This dashboard can be thought of as providing a “headlight’ view into what the organization will be spending over future time periods.