Table of Contents

Primer on Standard Costing

Facebook
Twitter
LinkedIn
Email
WhatsApp
Primer on Standard Costing

Overview

Costing is an area of many businesses that plays a major role in how profitable the business is.  Whereas aspects of sales and customer related activities are external to the business and can be affected by market factors, external forces, and competitive pressures, the cost to produce items tends to be very much under the organization’s control.  This includes the cost paid for raw materials via purchasing activities, the labor and machine hours expended to produce an item, and the level of inventory used to support a given level of sales.  Additionally understanding the cost of what is being produced also enables an organization to properly price that item to recoup all of the other costs of operating the business that cannot be directly tied to a particular product.  This is often called the margin or gross margin that can have a significant bearing on the profitability and competitiveness of the organization.  

In this blog we will examine some basic aspects of costing, specifically standard costing in a manufacturing organization.  In products that are produced in volume using consistent components and operations, standard costing is an extremely valuable way of tracking the organization’s internal operations.  If in contrast, the organization produces non-standard products that are highly customized and engineered uniquely for each order or customer, standard costing has much less value.  

Another benefit of standard costing is that it helps an organization determine how to acquire components to be used in their products.  As will be discussed below, there is more than one way to look at costing.  An organization may decide to source some or all of its products externally.  Standard costing gives an organization a good baseline to understand whether to make or buy a particular product or component.  

When looking at costing there is an element of the organization’s business model that can come into play in how they approach costing.  In my earlier days in manufacturing my company would apply different models to costing depending on the current state of the economy.  When the economy was good and the manufacturing plant had more work that we could handle, we applied an approach that the accountants referred to as “full costing”.  In this posture all costs were considered and the typical approach was to find an external vendor who could make the part cheaper when compared directly with the plant’s “full cost”.  The end result was that most work was outsourced to third parties.  When the economy was not doing so well, we applied an approach called “out-of-pocket costing”.  In this posture we only looked at the direct hours cost for the manufacturing process versus the out-of-pocket cost to source the part externally.  The end result of this approach was that in most cases we brought most work back into the plant to produce in-house.  

I only illustrate these two approaches to highlight that an organization’s approach to costing does not have to be cast in stone, but is in itself a representation of how the business wants to manage itself.  Standard costing represents a very consistent way for an organization to measure itself against what it thinks it should actually take to produce something.  Standard costing attempts to smooth out variations that occur throughout the regular operations of a business.  It incorporates the various overhead costs that a business requires to function, but cannot be easily tied to a specific production operation.  They include the cost for support organizations like purchasing, engineering, human resources and the cost facilities, rent, equipment, taxes, insurance, etc.  There are a myriad of elements that go into overhead costs, the better an organization is able to capture them and accurately apportion them across the manufacturing operations the better they will be able to assess how they are doing in the operation of the business.

Below we will examine what are the elements that make up costing and how those apply to standard costing.

Components of Costing

Below are the primary elements that most manufacturing organizations will use to establish their standard costs.

  • Direct Costs
    • Set-up Labor Rate – The hourly rate of the labor needed to set-up a machine.  This is often higher than the machine operator labor rate as it may involve a more skilled individual.
    • Run Time Labor Rate – The hourly rate of the machine operator assuming the work center requires a certain skillset and experience .  If the operator can run multiple machines this would not impact the labor rate, but would impact the hours needed to produce a part ie.the labor content. The Labor rate should cover all the costs related to the employee including benefits.
    • Machine Rate – The cost per hour to run the machine including the lifecycle cost of the machine, acquisition, maintenance, operating and  replacement cost.  If a machine can produce multiple parts in a given operation that is reflected in the time needed to produce the part.
    • Material Cost – Cost of material needed to produce one part.  It can include typical wastage that occurs as part of the manufacturing process which is accounted for by the scrap factor. 
    • Overhead Rates  – For each Labor hour and Machine hour, overheads or burden rate is added. This is the administrative cost and the cost of running the facility based on a certain level of business activity estimated at the beginning of the year. This can be classified as fixed and variable overhead. 
  • Indirect Costs
    • Factory or Department Overhead – The cost of various activities and facilities needed to support the factory when producing a product.  These can include supervisory costs, insurance, facility costs or anything that can be tied directly to the operation of the factory or manufacturing plant. 
    • Selling General and Administrative (SG&A) Expenses – This is often a grab bag of other costs that are incurred in the operation of the business.   They include the cost of the many activities like the office staff, engineering resources, sales expense, etc. that are incurred to run the business but by their very nature cannot be individually tied to a specific product 

Many organizations and specifically manufacturing operations will use an ERP system to manage the operations of their business.  A well implemented ERP system can enable a manufacturing organization to capture and manage through these various cost elements and accurately apportion them to various activities of the business.  Typically within the ERP System there is a mechanism to collect all of the various costs occurring in the business and aggregate them at the individual item level and the overall product level via a Bill of Material (BOM).  How this is accomplished within the ERP system, will vary by the system and be specific to each software product.  As this is a general discussion on standard costing, we will avoid going into details about a specific ERP system’s implementation of the concept.     Below we discuss other factors relevant to standard costing, before we look at some analytics capabilities that can help in the management of standard costing. 

Other Factors to Consider

  • Lot Size – In a manufacturing environment the lot size is the amount typically produced in one order.  Larger lot sizes enable the spreading out of the set-up costs across a larger quantity of product.  The downside of a larger lot size is that it may result in more product sitting idle in inventory for longer periods.  Most ERP systems have a way to allocate set-up costs based on lot size.
  • Efficiency – A deviation from the standard.  In an ideal situation this is 100% but there may be a variety of extenuating circumstances that would cause this to be less than 100%.  Factors such as Labor breaks, human fatigue, machines not optimally suiting for the operation, tooling that is suboptimal, and other factors may influence efficiency.  Again most ERP systems have ways to account for these factors. 
  • Scrap – In any given manufacturing operation sometimes product is damaged or lost in the process.  This is referred to as scrap and again most ERP systems have a built in means of accounting for these losses.  
  • Yield –  Yield is the measure of how much of what you start with are you able to make successfully.  Generally thought of as a percentage, it measures the amount of non-defective items you produce out of all the items you produce.
  • Combining Overhead Costs – Depending on the specific ERP system an organization uses, it may make sense to combine some of the previously mentioned overhead costs such as the Factory Overhead and the SG&A overhead.  This is often dependent on the ERP system used and how it allocates and apportions costs 
  • Variance – Variances can occur when the operations deviate from what is built into the standard.  Depending upon the specific ERP system in use, there are ways to account for and reconcile these variances  
  • Value in Inventory – One important concept regarding standard costing is that it is used as a means of recording the value of items in inventory.  Any time something goes into inventory or comes out of inventory it does so at the standard cost.  This is an important consideration for why standard costs need to be accurate and reflective of the real cost of producing, storing, and selling items. 

Analyzing Standard Costs

Within the ERP system tracking and reporting on the costs necessary to produce the various products produced is a valuable and core capability of the system.  Being able then to report on those costs, how well they align with the standard costs, and adjusting or course correcting the standard costs enables an organization to improve and better manage its internal operations.  

We will examine some capabilities below to look at Variances and Yields and then look at Standard Costs.  All of these metrics can contribute to managing the internal operation of the organization and in catching events or situations that can skew the cost structure and play havoc with margins and profitability.  Lastly we will examine how to review existing standard costs and update them as appropriate.

Material Usage Variance

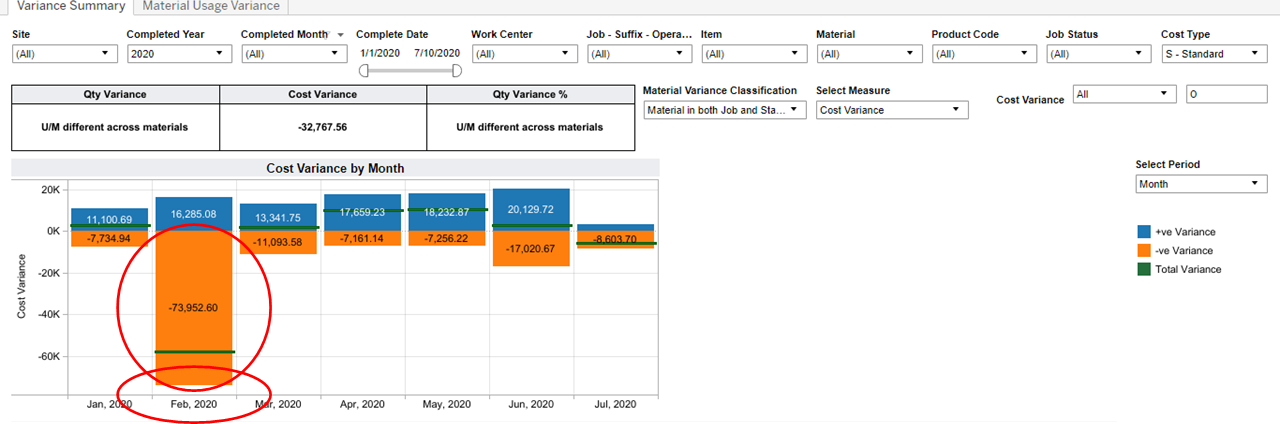
First we will look at Material Usage Variance.   Below in Figure 1 we can see a graphical depiction of Material Usage Cost Variance by month for a given period in 2020.  It is clear from the dashboard below that there is major discrepancy in the month of February of over $73,000 (see two red ellipses below).  If we click on this part of the graph the system will allow us to drill into the detail of the data for that month.

 Material Usage Variance Summary over time
Figure 1. Material Usage Variance Summary over time

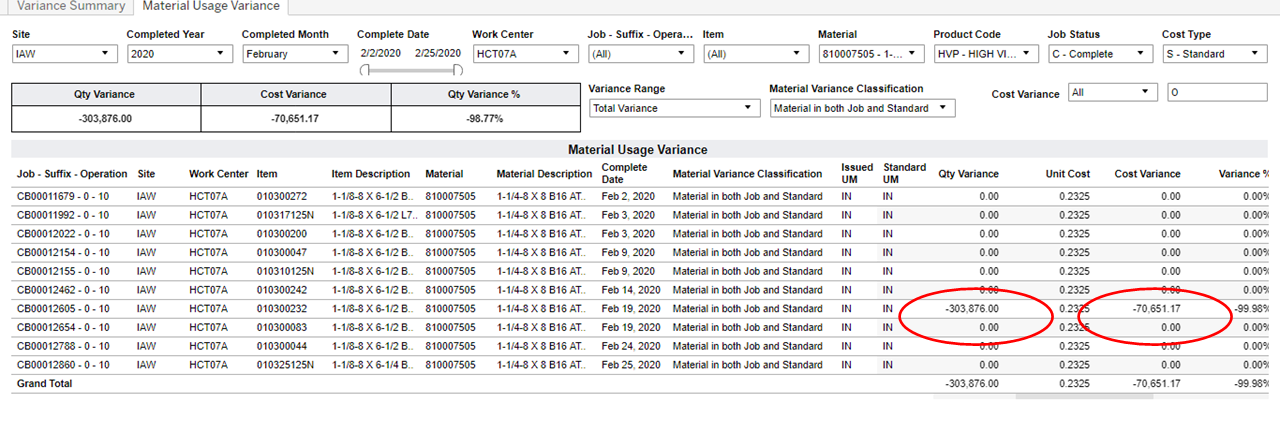
Below we can now see the detail of the data via the Material Usage Variance report below in Figure 2.  In the detail below we can see that on February 19th there was a specific Job CB00012605 Operation 10 on Work center HCT07A that had a significant variance in Material usage from what the standard indicates.  (see red ellipses below in Figure 2).  With this information the management can investigate the Job, and Work Center on this date to understand the nature of the discrepancy.  

Material Usage Variance Detail
Figure 2. Material Usage Variance Detail 

Production Yield

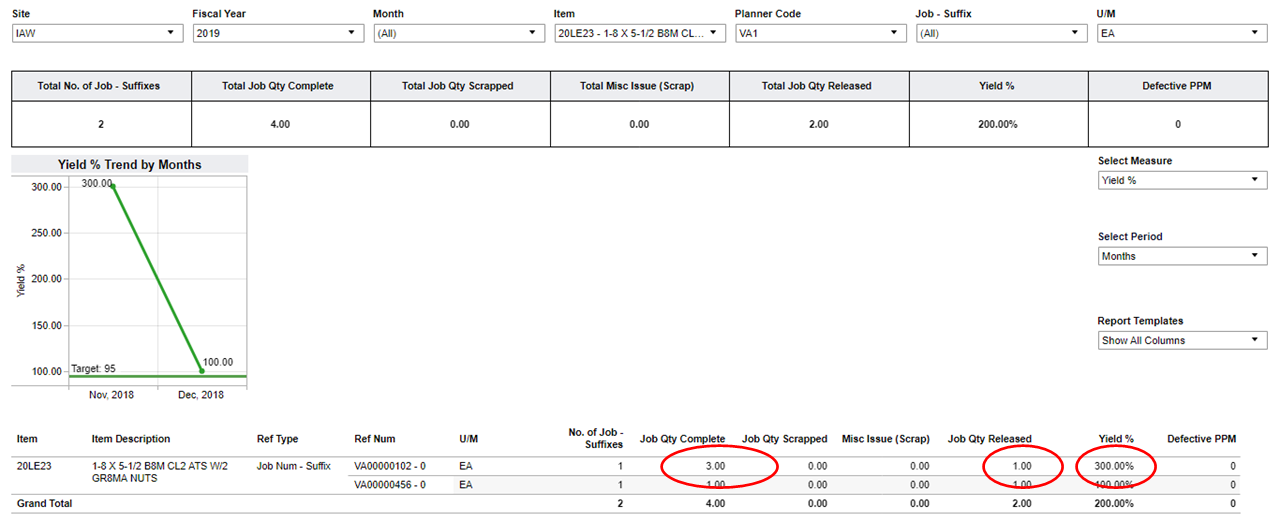
Another important metric is Yield.  Yield is often expressed as a percentage.  Below in Figure 3 we are looking at a report that shows for Item 20LE23 we are seeing a 300% Yield.  This data should immediately be suspect as any Yield exceeding 100% is highly unlikely.  If we examine the detail below we can see that the Job had only 1 Item Released, but that 3 Items were reported as being completed.  Most likely this is a data entry error.   The report below provides the detail the organization would need to correct this error and prevent it from happening in the future.

 Production Yield By Item
Figure 3. Production Yield By Item

Review Labor Hours

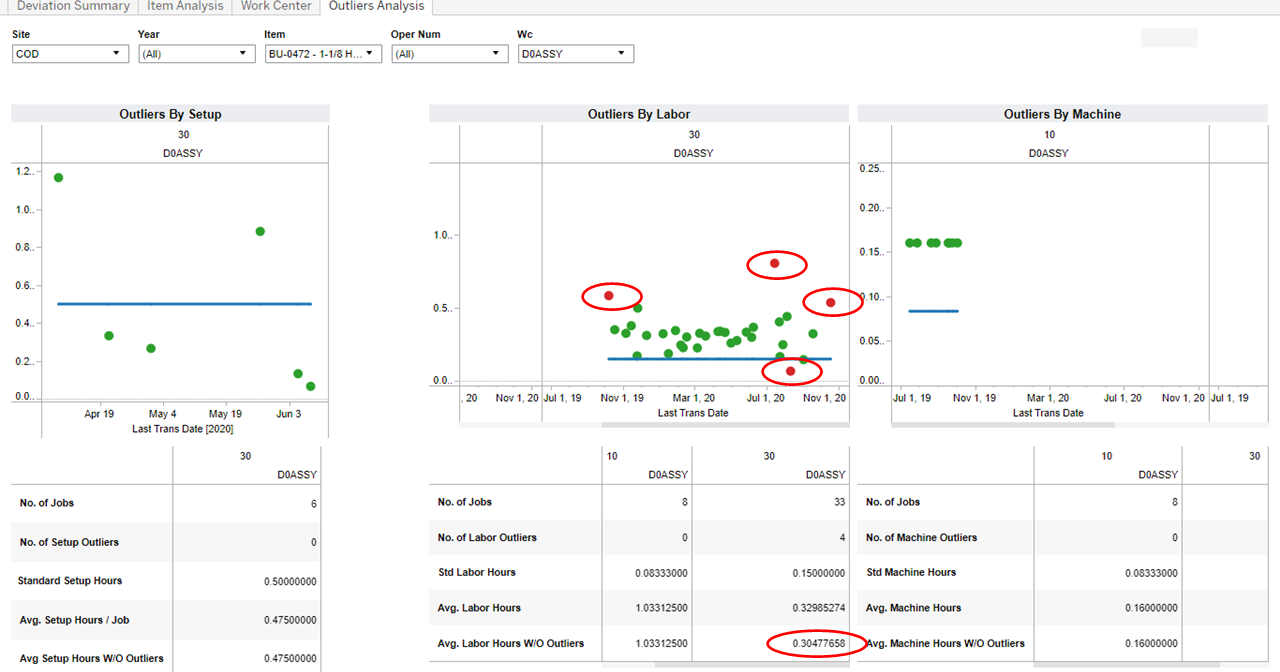
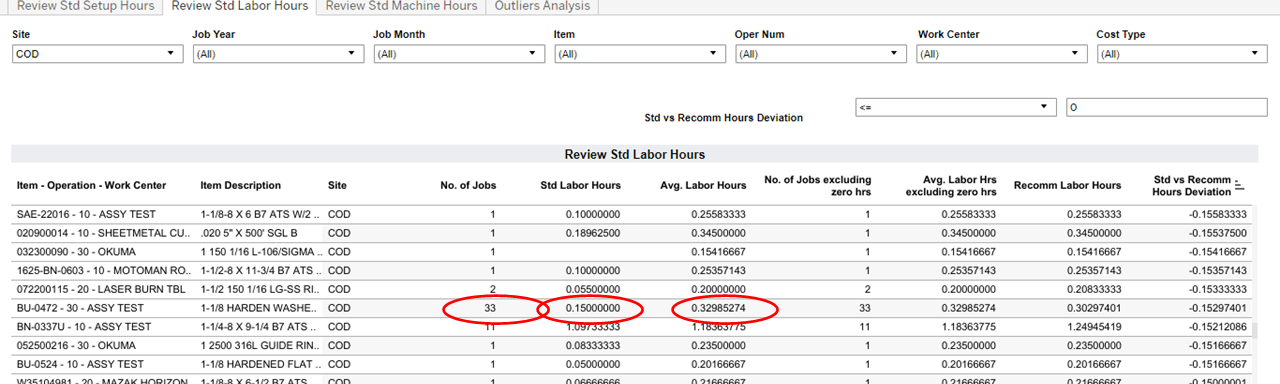
Most manufacturing organizations manage and pay close attention to Labor Hours that go into producing their product.  Below in Figure 4 we are looking at a report that shows Labor Hours by Item and Operation.  In this data we a particular Item BU-0472 and Operation 30 Assy Test that had a large number of Jobs run (33 in this example) and the Labor Hours are almost double what you would expect from the standard (0.3298 per Item versus the standard of 0.15 per Item) (see three red ellipses below in Figure 4)  

 Review Standard Labor Hours By Item - Operation - Work Center
 Figure 4. Review Standard Labor Hours By Item – Operation – Work Center

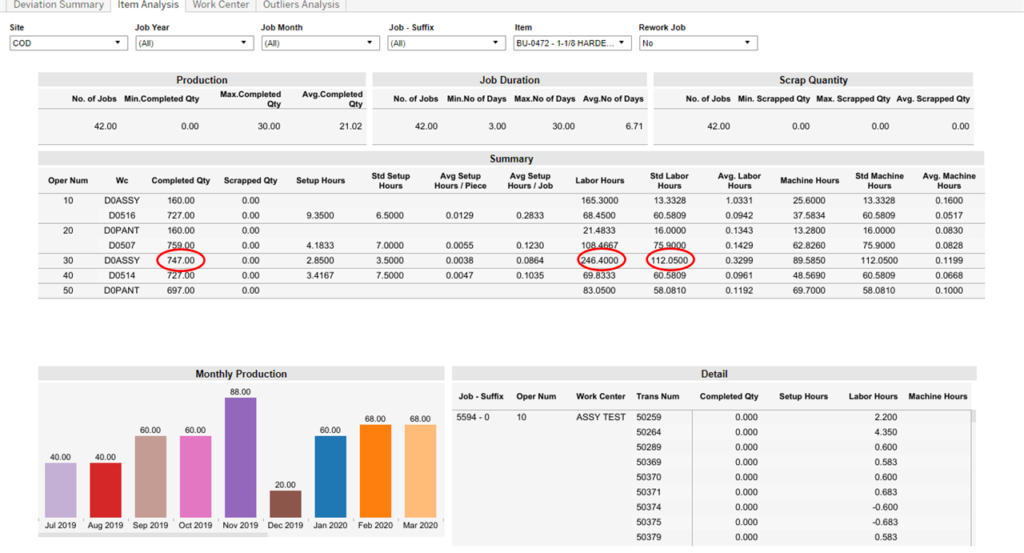
By then moving to the Item Analysis dashboard we can look at specific details of this Item.  Below in Figure 5 we can see the total Production activity for this Item over the prior year.  We can see that 747 of these items were completed in this time frame.  The Standard indicates that this should have taken 112 Labor Hours but in actual fact took 246 Labor Hours (See three red ellipses below in Figure 5)

Item Analysis Dashboard by Item
 Figure 5. Item Analysis Dashboard by Item 

By then looking at the Outlier Analysis we can see which specific Jobs on which Dates may have contributed to the differences in the Actual Hours reported from the Standard Hours.  Below in Figure 6 you can see the detail of the different Jobs being plotted by Setup, Labor and Machine Hours.  The middle graph shows Labor Hours which we are examining.  In it, for Operation 30, the red dots indicate jobs with a significant Variance from the Standard.  (see four small red ellipses below).  The blue line represents the actual Standard hours for that operation. In this instance we can see the overall number of Jobs, represented by the green dots, still seems to vary significantly from the Standard.  If we look below at the Labor Hours expended on these Jobs even with the Outliers removed, the hours at 0.3047 differ significantly from the Standard of 0.15 from this Operation (see large red ellipse below).  In this particular case, it is probably an indication that the Standard should be adjusted upward to more realistically reflect the Labor Hours required for this Operation.  .   

Outlier Analysis By Item and Operation
Figure 6. Outlier Analysis By Item and Operation

Summary 

In this blog we have examined some of the elements that comprise Standard Costs in a manufacturing environment.  We have looked at how some of those Standard Costs can be tied to Direct activities that can be tied to a specific manufacturing operation.  We have also looked at Indirect activities which occur throughout the organization and are not as easily assigned to a specific manufacturing operation.  We have explored how an ERP system can enable an organization to apportion these different costs across their operations.

We have also examined how other dimensions such as Yield, Scrap, Variances, Efficiency and Lot Size can impact the apportionment of costs to Items as they are produced.  Our focus was on Standard Costs as in a higher volume environment, Standard Costing tends to smooth out variations in Product Costs over time.  We also understood how Standard Cost is the metric used to measure the value of any product in Inventory.

Lastly we explored some tools that enable Analysis of the different costs incurred in the business.   We looked at capability to examine Material Usage and in particular when usage varied from what was expected.  We showed how that Variance in usage could be tied to a specific Job, Work Center and Date.  We also examined data on Production Yield and took a look at a specific instance where the yield data was inconsistent with expectations.  From that we identified a specific Item and Job where the data was apparently incorrectly entered.  We also explored some Standard Labor Hours versus what was actually reported.  In one example we were able to demonstrate across a substantial number of jobs, that the Standard may need to be adjusted as it was significantly different from what was being reported across a substantial population of work.  In that same analysis we showed how Outliers or Jobs that may have had one time issues could be filtered out of the analysis.  

As a provider of technology, we can enable the capabilities described above for your organization and improve how you manage and refine your standard costs.  Please reach out to us and we can delve into the subject in more depth.

Schedule a Demo to look at the numerous Manufacturing KPIs that IntelliDash offers from your Infor CSI/SyteLine data (On-prem & Cloud alike)

This site tracks visits anonymously. Click the link to know more about our Privacy Policy.