Table of Contents

What is Analytics As A Service?

Facebook
Twitter
LinkedIn
Email
WhatsApp
Analytics As A Service

Overview

The concept of “As A Service” has become quite pervasive in recent years. There is literally about anything you can imagine being offered “As A Service”. There is in the Information Technology (IT) world Infrastructure As A Service (IAAS), Platform As A Service (PAAS) and Software As A Service (SAAS). Each of these describe a different set of capabilities that can be delivered as a service in the IT space. 

While these various IT centric “As A Service” offerings may seem confusing, an easier way to understand the concept may be to look at typical automobile transportation. If you own or lease an automobile then you have to manage all aspects of that ownership including acquiring and paying for the asset (either via a purchase or lease), vehicle registration fees, refueling, maintenance, insurance, storage (i.e. a place to park it when not in use), etc. These are very traditional requirements and anyone who has ever owned or leased an automobile expects to put forth the effort to provide and also absorb the cost for these items. 

Now flip that traditional ownership model around to an “As A Service” approach which is essentially what the various ride sharing services provide. You call for the transportation via an application (app) on your smartphone, it arrives, transports you to where you want to go, and you pay the usage fee. Such things as loan or lease monthly payment, vehicle registration fees, fuel, maintenance, insurance, and storage are not your concern as they are all provided to you by the service provider. You simply use the service and the provider takes care of the rest. This is essentially the appeal and value of any “As a Service” offering. All the traditional burdens and management responsibilities of ownership are outsourced to the service provider. You simply consume the service when and where and how you need it.

As A Service 

It would be instructive to understand what are some key capabilities that make up “As A Service”. Then from there we will look at how this applies to “Analytics As A Service”. 

There are some generic aspects of services that we will briefly discuss then we will dive into the more specific aspects and especially as they relate to “Analytics As A Service”

Generic Attributes

Attribute Description
Lack of Ownership The consumer of the service does not own it but only consumes it. 
Perishability Cannot be stored for later use. Is consumed at the time it is provided, making it very intangible.
Inseparability A service is produced and consumed at the same time. The service cannot also be separated from their providers.
User Participation The user consumes the service as it is provided. The service cannot also be separated from the user.
Quality Quality is based on the perception of the user. A user is the sole arbitrator as to the quality of the service.

Specific Attributes

Scalable – One of the primary appeals of a service is that it can be scaled by the service provider to meet the level of demand that is required. If demand is high the service scales up to meet that demand, if demand is low the service scales down to meet the lower demand. Traditional electric utilities have provided this capability for decades as they organized their entire electric network and infrastructure to meet “peak demand”. You and I as the electric consumer never see any of that as it is all taken care of for us.

Fees Based on Usage – The consumer of the service pays for that service via some payment model based on usage. If you are consuming travel via a ride sharing service there is a fee usually based on the mileage traversed. There can also be peak usage surcharges incorporated when demand is especially high such as during specific events that might tax the system capacity. In addition, in a ride sharing scenario, the surcharges might attract more providers thus making more capacity available when it is needed.

Minimal User Effort Required – The consumer of the “As A Service” generally has to put forth little effort in using the service. The user of the service might have to establish an account or some other means of being charged for the service, but once set up, there is little other investment of time by the user. Using the electric utility example described above, the user often needs to only flick a light switch to take advantage of the service. 

No Management by the User – The user of the service does not need to manage any of the back-end details of the service. The details are all managed for the user without any effort required. A pastor I once knew perhaps described it best when he said “The more stuff you have, the more time you spend taking care of your stuff.” Whether it is your house, your car, or your bicycle if you own these items, they all require some level of management such as mowing the yard, filling up the tank with gas, or pumping up the tires with air. If you are using a service, none of these responsibilities of ownership accrue to you, the service provider addresses all of those responsibilities.

Expertise and Competence are Part of the Service – This is perhaps the most valuable attribute of an “As A Service” offering. When you acquire a service, the provider of that service is providing you the expertise and capabilities needed to make the service work. Consider a service as simple as an oil change service for your car: the service provider provides the right wrench to remove the drain plug, the right filter size to fit your vehicle, and the right oil weight based on your vehicle’s requirements. You need to know none of these things. 

Analytics 

To examine how these concepts apply to “Analytics As A Service” we should also understand what Analytics are and how that can be applied to the “As A Service” environment we have already discussed. Dictionary.com defines Analytics as “the analysis of data, typically large sets of business data, by the use of mathematics, statistics, and computer software”. We will examine Analytics particularly as applied in the business and Information Technology (IT) world more closely below.

The key word here, which is the root word of Analytics, is analysis. Analysis involves a closer inspection of something primarily to understand what may have transpired in the past. Analytics then focuses on why it happened and what may happen in the future. 

In the world of business, Analytics involves the manipulation, aggregation, and presentation of data into a form that can be consumed by a user and illustrates any pattern or insight that might be embedded in the business data. Analytics to be valuable must include the following components:

Data – There must be a source of data and that data must be reliable and accessible. For many organizations their Enterprise Resource Planning (ERP) system is the primary source of the data. ERP systems are great at capturing and organizing transactional data, but not so good at organizing that data for analysis. Often a re-organizing of the data into a data warehouse is necessary to enable it to be structured in a way that supports analytics.

Metrics – An organization has to have some way to judge whether what their seeing is good, bad or indifferent. These metrics can be a quantity, a volume, dollar amount, number of hours, etc. These are often referred to in business as Key Performance Indicators or KPIs. If a 100 widgets were produced yesterday a KPI can tell us if that was on target, way below target, or way above target. Such metrics can often be displayed in an Analytics system as a static line or bar or via some fixed reference point to the actual data. 

Presentation Format There must be some way to present the data in a format that illustrates the business question being asked. This could be in a tabular format, or graphical format whichever best serves to illustrate the data and the metrics being examined. These are often referred to as “dashboards” borrowing the term from the automotive world wherein a dashboard provides relevant information about the vehicle such as speed, engine temperature, fuel level, etc. So a “dashboard” in the business world can provide information about inventory levels, product margins, order status, etc.

Selectability / Sortability – There must be some capability to filter the data via a selection process. This can take the form of examining sales data for the entire company then filtering that to sales for a specific salesperson, or sales for a specific region, territory, or country. This enables one report or dashboard to function specifically for the user’s area of interest and does not require the creation of multiple dashboards or reports. In addition, the data must be sortable. So that a user can sort it from high to low values or vice versa. This enables a user to focus on only the most important values such as which customers buy the most from us, or which vendors are we buying the most from, etc.

Drill Down – Often data is presented in a summarized form to provide a big picture look at the data. Having a drill down capability into this data enables a user to look at specific details that aggregate up into the bigger picture. One example might be to look at an overall Sales Margin report. That data can then be drilled into to show the Sales Margin for a specific customer. Then that data can be drilled into to the specific Customer Orders, etc. A well-structured Analytics system should allow the data to be drilled into at the lowest level that data has been captured in the system. Whether down to line item detail in a Customer Order, Labor Hours by Job Step, Production by Item by Job by Production Date all of these details if embedded in the data, should be accessible by a user via a drill down capability in the Analytics system

Analytics As a Service 

If we then take these two concepts and combine them, we have what can be called “Analytics As A Service”. Below we will illustrate what this actually looks like in practice through a few basic examples.

The following examples illustrate how this would play out for a user. Below is a list of what the user would need to use the service:

  • An assigned user ID
  • A password
  • A device, either computer or mobile device
  • A browser 
  • The appropriate Web address or URL.

With these the user can access the system and begin to use the service. To illustrate what this looks like in a real “Analytics As A Service” environment, there are some visual representations of this below:

Figure 1. Analytics As A Service login 

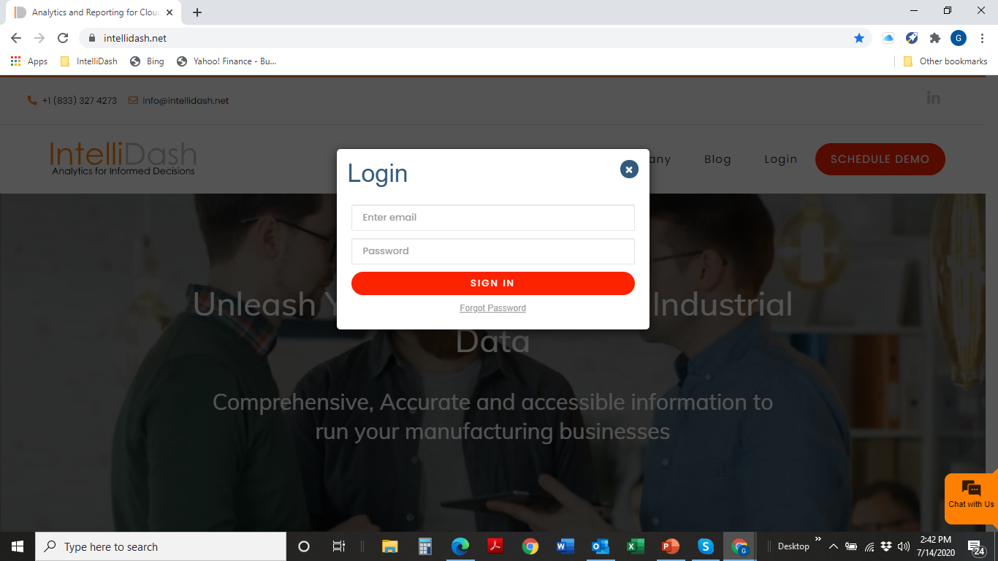
Once a user is logged into such an Analytics As A Service system then various views of data are available. Consider the following scenario that may typically occur. The Vice President (VP) of Sales receives a call from a customer asking about the status of Orders they have scheduled  for the existing month. The VP might first look in the Analytics As A Service system for the Sales Backlog Analysis dashboard (see Figure 2 below).  The VP then filters by the Year and Month that is being reviewed. (See two red upper ellipses below in Figure 2.) Looking down the dashboard there appear to be only orders from 3 Customers in the pipeline for this Month. The Customer who is making the call to the VP is the Diam Institute. (see third red ellipse in the lower part of Figure 2).  

Figure 2. Sales Backlog by Month

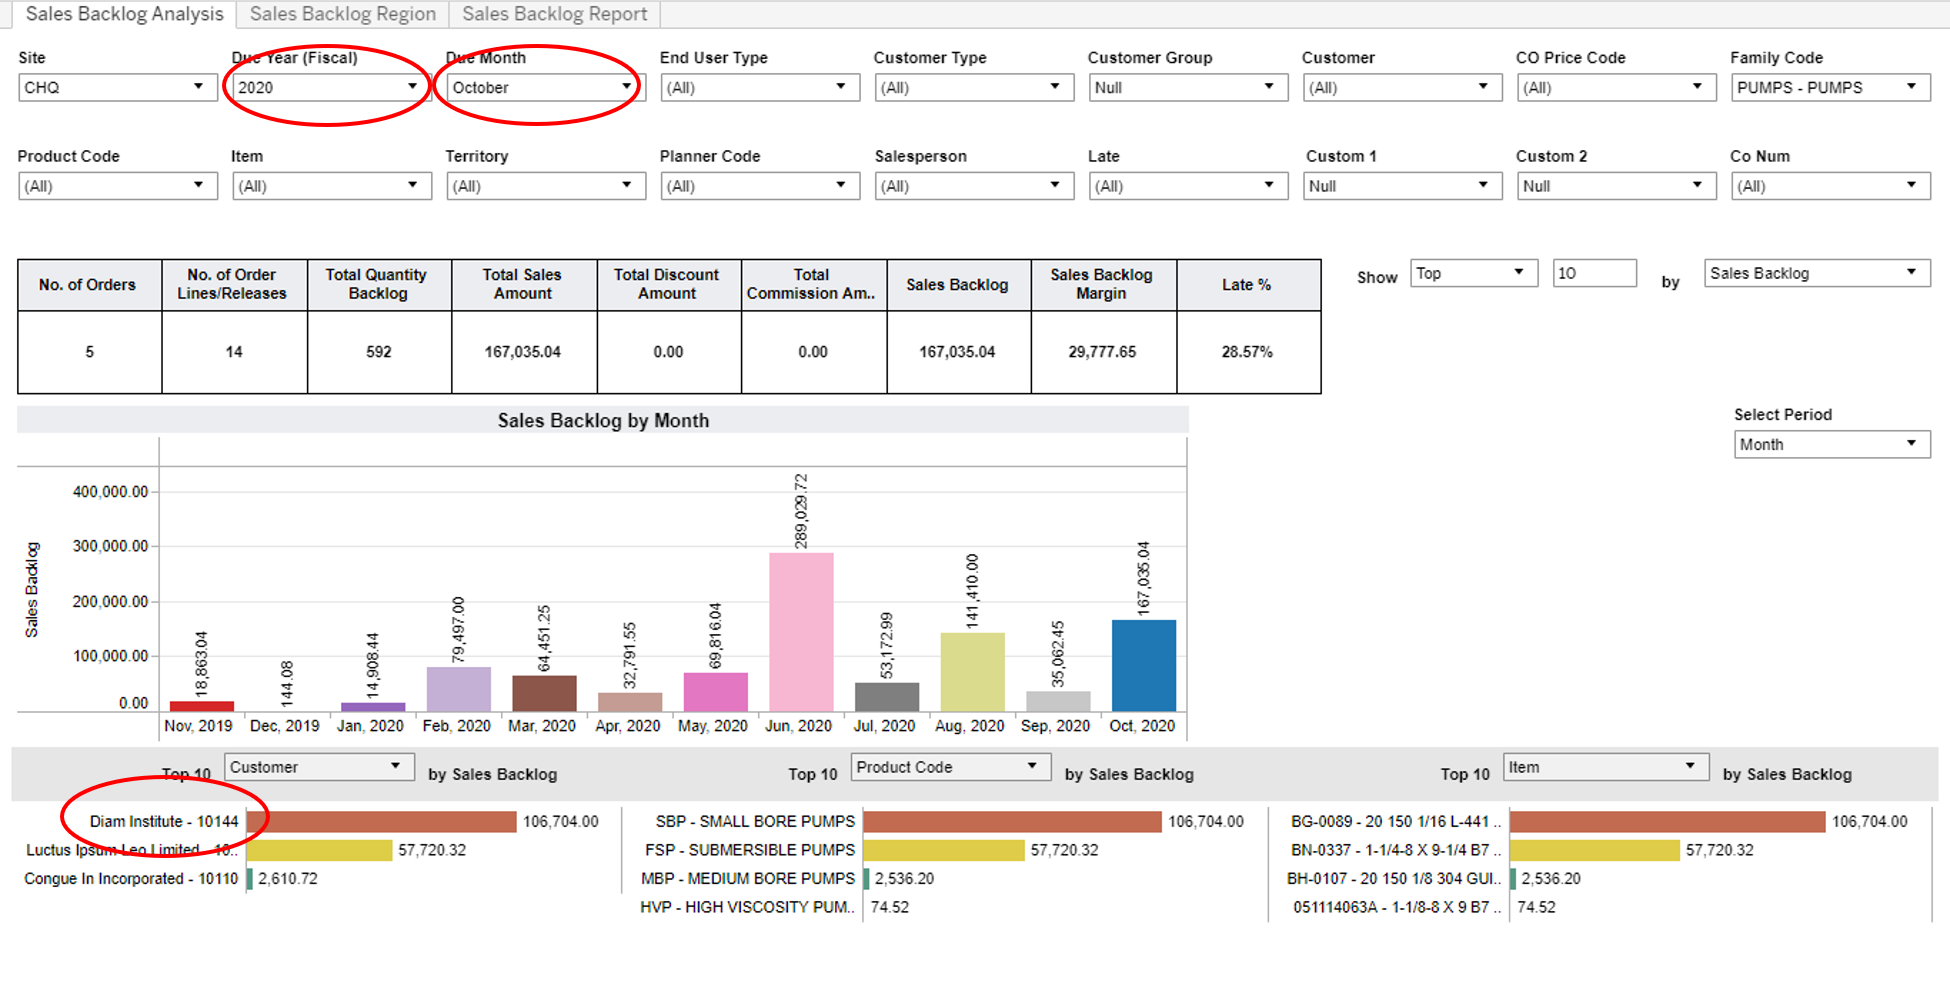
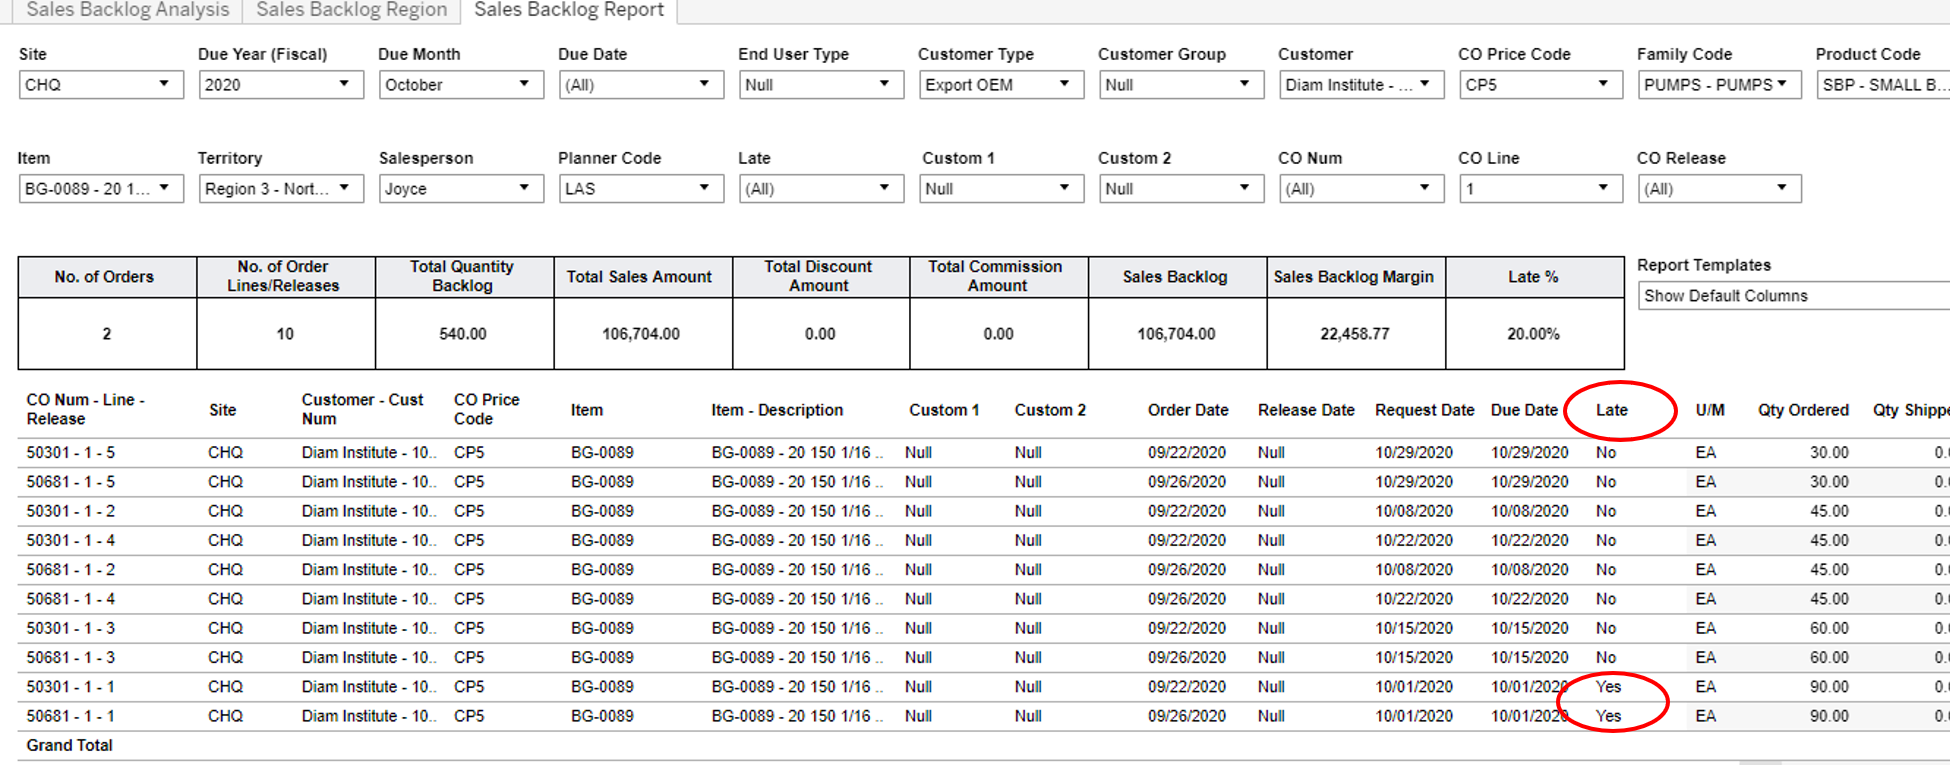
Then clicking on the bar for that Customer, the Analytics As A Service system will then drill down into the data for that Customer via the Sales Backlog Report (see Figure 3 below). This report is automatically filtered to show only the orders for the Customer, Diam Institute, in the Month and Year which were pre-selected from the prior dashboard. As you can see there are two Order Lines below that have clearly missed the Due Date, (see two red ellipses below), which is why the Customer most likely called. The VP of Sales could assure the Customer from this dashboard that the other Order Lines appear to be on track to meet their Due Dates. At this point the VP of Sales would most likely reach out to Operations to understand the reason for the missed Due Dates.    

Figure 3. Sales Backlog Detail by Month, Year and Customer

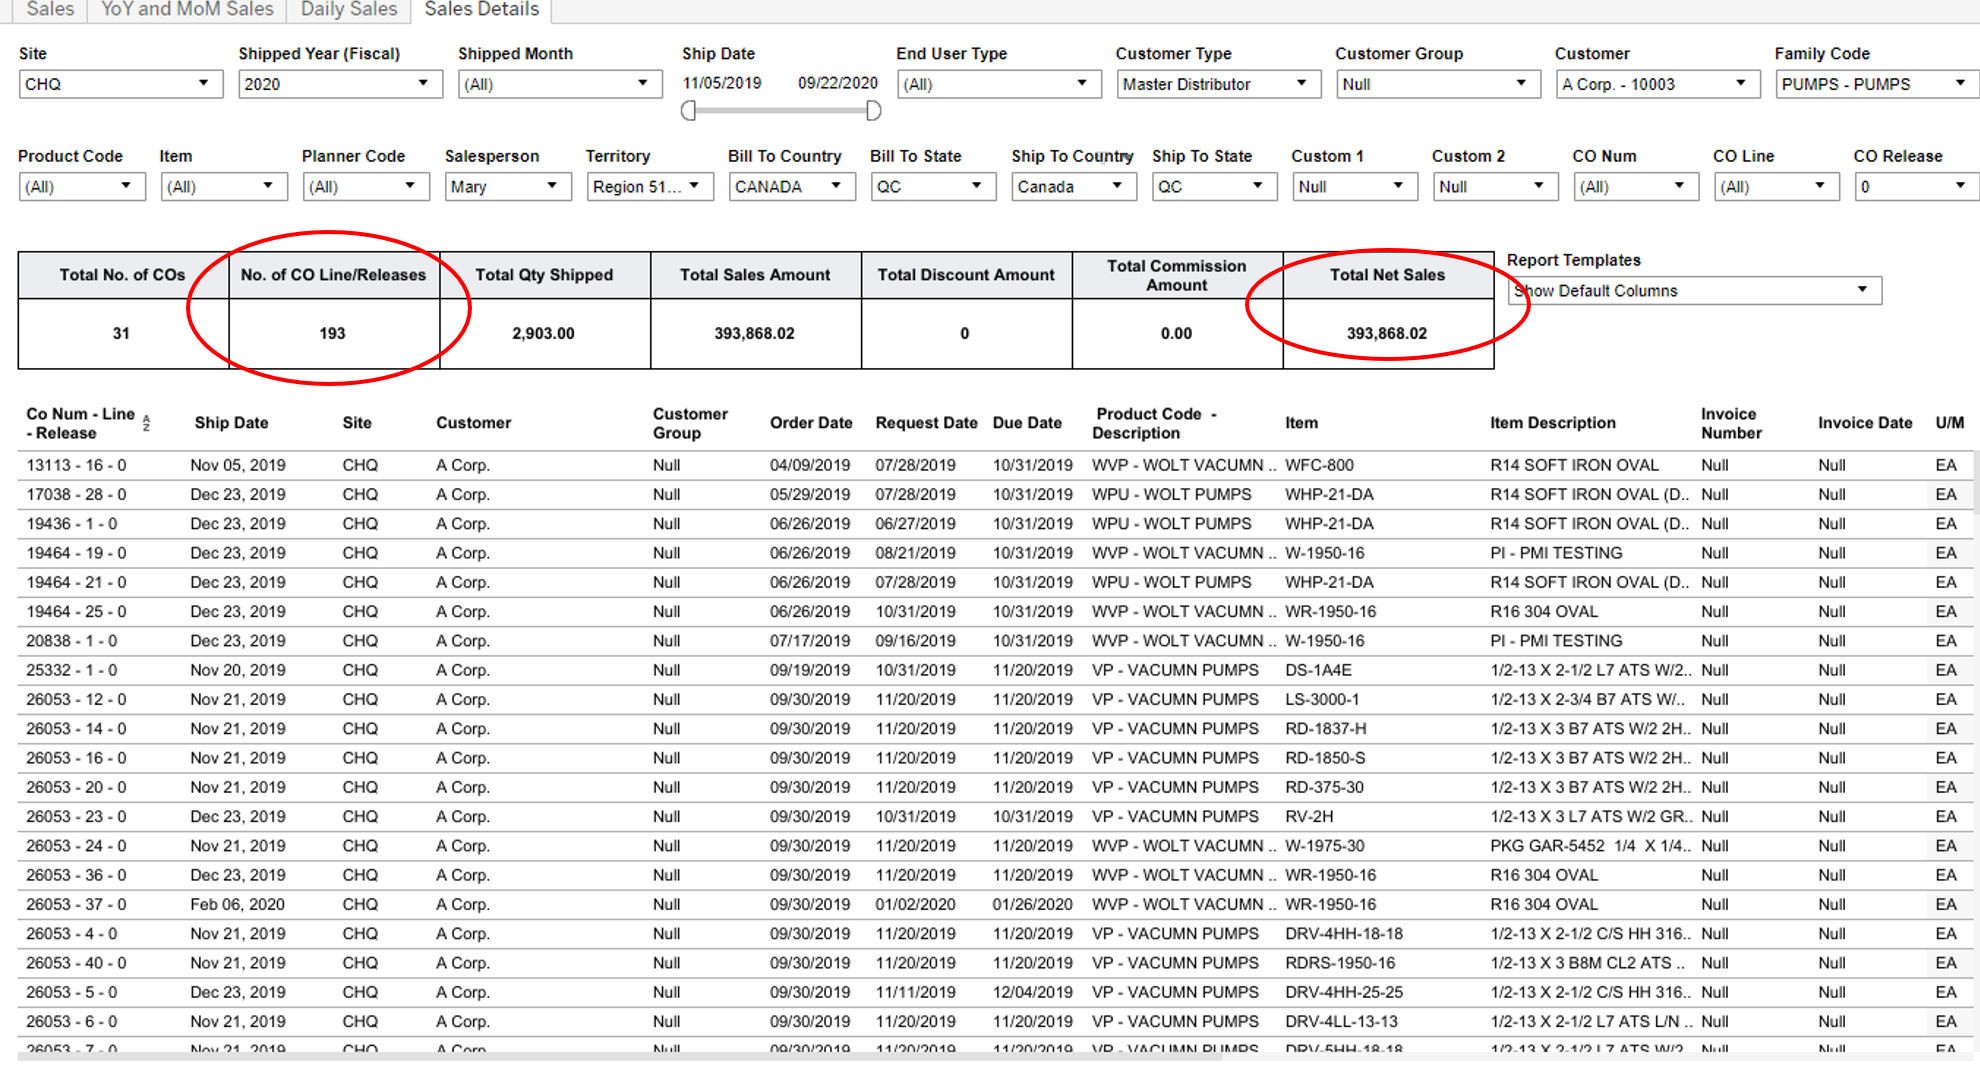
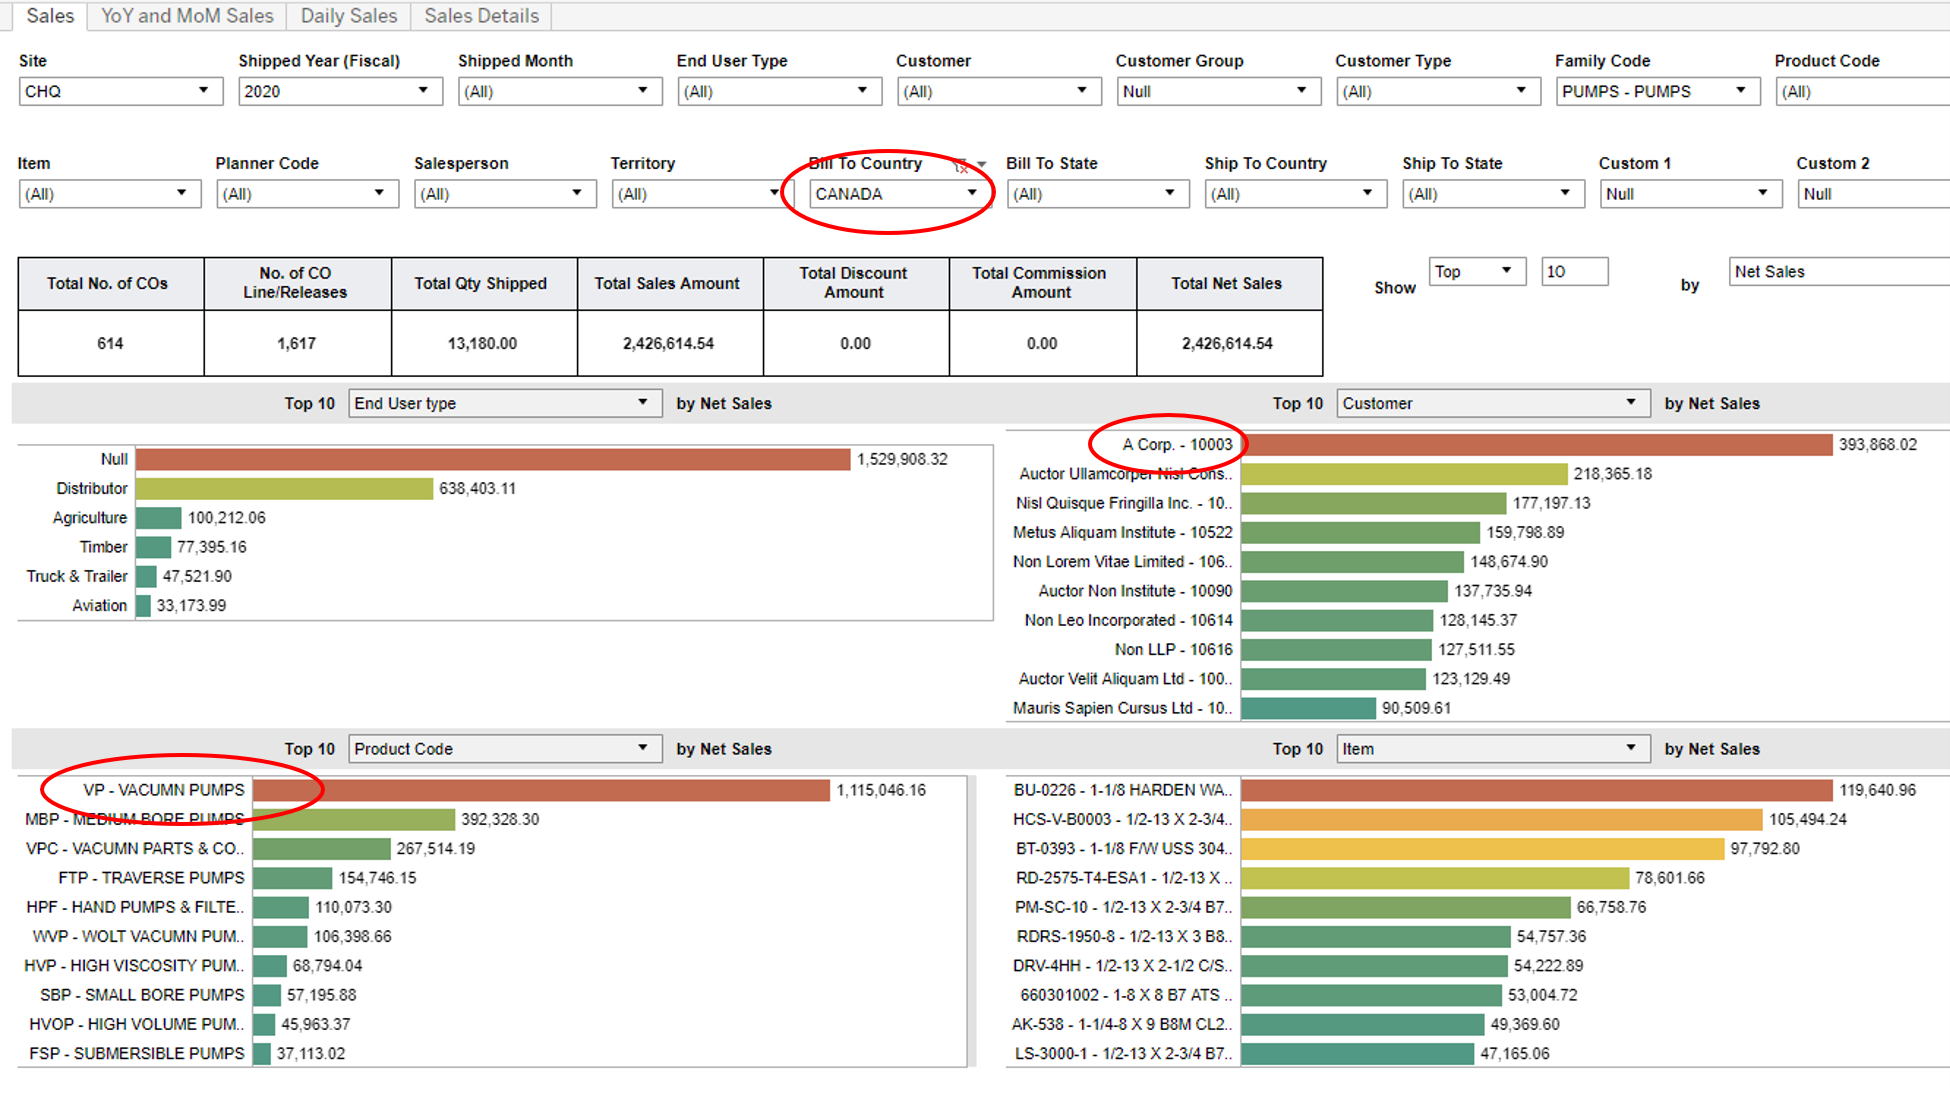
Consider another Sales related scenario. The VP Of Sales may need to better understand the state of current product sales to Canada.  The Analytics As A Service Sales dashboard below (see Figure 4 below) would be the first place to look.  This dashboard has been filtered by just Sales in Canada for the current Year (see upper red ellipse below). This dashboard also illustrates that most of the Sales appear to be to one Customer, A Corp, and the Product Code they are buying appears to be mostly Vacuum Pumps (see two lower red ellipses below).  

Figure 4. Sales by Country (Canada) for Current Year

Finally the VP of Sales can click on the bar graph for Customer A Corp and the system will drill down into the Sales Detail dashboard shown below in Figure 5.  Viewing this dashboard provides details about all the Orders this particular Customer has placed within the past Year. The total number of Order LInes placed and the Total Net Sales for this Customer (see red ellipses below) are displayed along with all the Order Detail below this summary data.  

Figure 5. Sales Detail by Customer for Current Year

Summary 

We have examined some of the attributes and capabilities that are part of a service. As part of this exercise we have explored why the concept of providing something “As A Service” has become so widespread. In short, a consumer of an “As A Service” gains the benefits of the providers expertise, infrastructure, and experience without having to acquire assets, manage assets, and guesstimate just what scope and scale of asset investment is needed. Instead the consumer of the “As a Service” pays only for what they use, when they want to use it, and leaves the other responsibilities to the provider of the “As A Service”.

We also additionally examined what is needed as part of an Analytics solution. The components for an effective Analytics capability include the data to be analyzed, a capability to present that data in multiple formats, some metrics that can be applied to that data, and an ability to filter, and drill into the data. The combination of all of these capabilities are necessary for an effective Analytics solution.

Finally we examined what it would look like to combine these two aspects into a “Analytics As A Service” offering. We examined at a very basic level the various components needed for a user to access such a system. We showed how one can log into such a system as a user and access a dashboard focused on a Sales environment looking at the Order status for a specific Customer for a specific time period.  Then through a series of mouse clicks we showed how that data could be drilled into for more detail to enable a user to focus on a particular problem or issue they might want to examine. 

If this approach is appealing to you in some way, reach out to us at info@intellidash.net and we would love to explore how this might work in your environment. 

Schedule a Demo to look at the numerous Manufacturing KPIs that IntelliDash offers from your Infor CSI/SyteLine data (On-prem & Cloud alike)

This site tracks visits anonymously. Click the link to know more about our Privacy Policy.